Note: This is part of an occasional series called “How Randy & Co Do It”.
We are a small but technology-heavy shop. We have a lot of servers, strict security requirements and a dispersed workforce. I also dabble and tinker a lot so because of that and other reasons our IT infrastructure is more complicated than most companies our size. My longtime sidekick Barry and I share responsibility for IT but we both have lots of other work to do so we try to set things up right and leave them alone. Nevertheless, things break and troubleshooting stuff can really kill our schedule and put us behind.
We needed something to help us keep a better handle on the status of our ever growing array of virtualization hosts, VMs, applications, VPNs, scheduled tasks and all the links between these components.
SolarWinds is one of our great sponsors and I’ve found them to be kind of a sweet spot in terms of IT tools with enterprise functionality yet with an SMB-size cost and complexity – perfect for us. So we worked out a deal with SolarWinds to try out their Server and Application Manager (SAM) and if it worked out well to share my experience. SAM is designed to help you “manage, monitor & troubleshoot application performance and availability”. We downloaded SAM early this year and here’s what we’ve found:
Installation
When you already don’t have time for troubleshooting the last thing you need is a trouble shooting tool that takes time to install and setup. SAM is a large download (close to a GB) but once you’ve got the file, it just installs – there’s no failed installs because of not having some version of .NET installed or whatever. If it isn’t there and SAM needs it, SAM installs it – including a built-in copy of SQL Server if you don’t have a SQL Server for handling SAM data.
Once installed, you just logon to the console and a wizard walks you through adding nodes for monitoring. Nodes are servers and other devices SAM can monitor. There are a number of ways to do this ranging from manual to automatic scheduled discovery of new nodes. I simply entered a range of IP addresses for my Windows servers to start out with and provided a domain credential. SAM automatically found all our servers. Then it showed the applications it automatically recognized on each server and allowed me to confirm them for monitoring.
Applications
That brings me to one of the features I really value about SAM and that is it’s concept of “applications”. SAM doesn’t just monitor systems, it also catalogs the applications found on each system and then automatically builds a dashboard that shows you the status of each installation of that application across all your servers. For instance, the SQL Server dashboard allows you to see how SQL Server is running across your entire network wherever it is running. This is a great way to look at your network instead of strictly in terms of each server and the apps running on it.
SolarWinds recognizes hundreds of applications out of the box and knows how to determine if the application is “up” which of course varies from one application to another. For instance, with SQL Server it knows each instance needs at least the main database service to be in the running state in order to count the application as up. SolarWinds aggregates all this status information into a pie chart so that you can instantly visualize the current status of each application across the entire network.
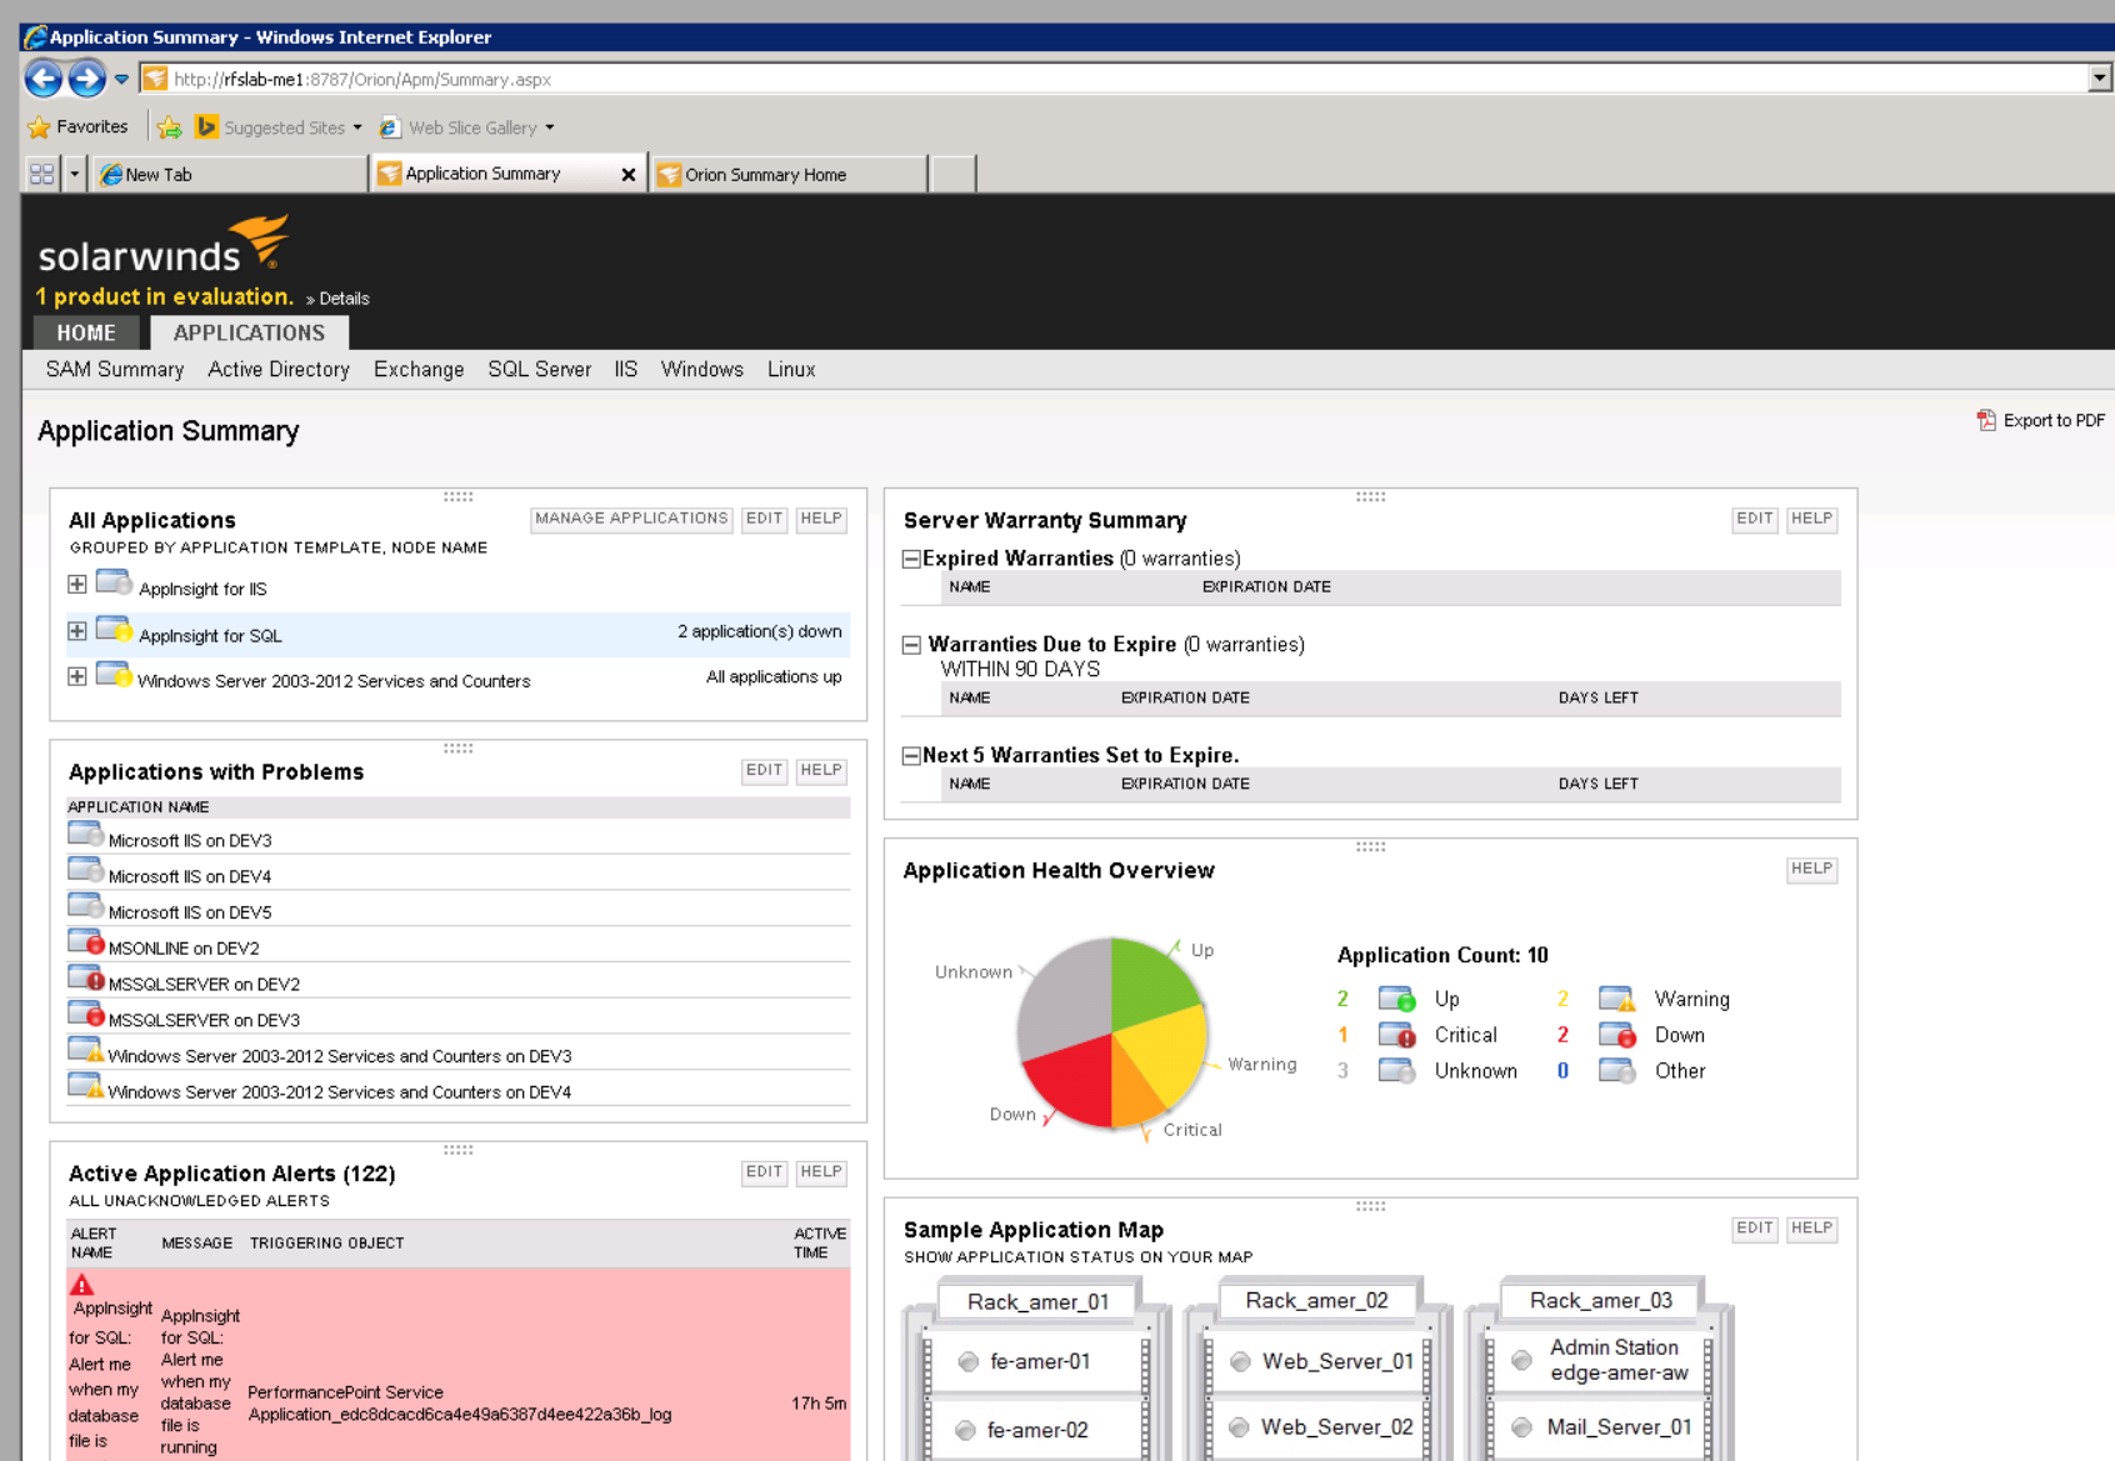
But there will always be applications that SolarWinds, or any other monitoring solution, doesn’t know about. For instance we have a scheduled task that runs every few minutes to move form submissions from our websites over to our CRM system. Normally I would have just created a monitoring rule to alert us if SAM sees any error events from that process. But it occurred to me that I should set this up as an Application in SAM. SAM can monitor anything (see below) you need to and you can group these monitors as custom applications which are then surfaced on dashboards side-by-side with the shrink wrapped apps that SolarWinds recognizes out of the box. At the top level, you can get a quick visual idea of the overall health of all applications and then drill down. For a given application you can see everything being monitored about it which may vary between many different data types such as:
- Service status
- Event logs
- Performance counters
- Response times
- File sizes
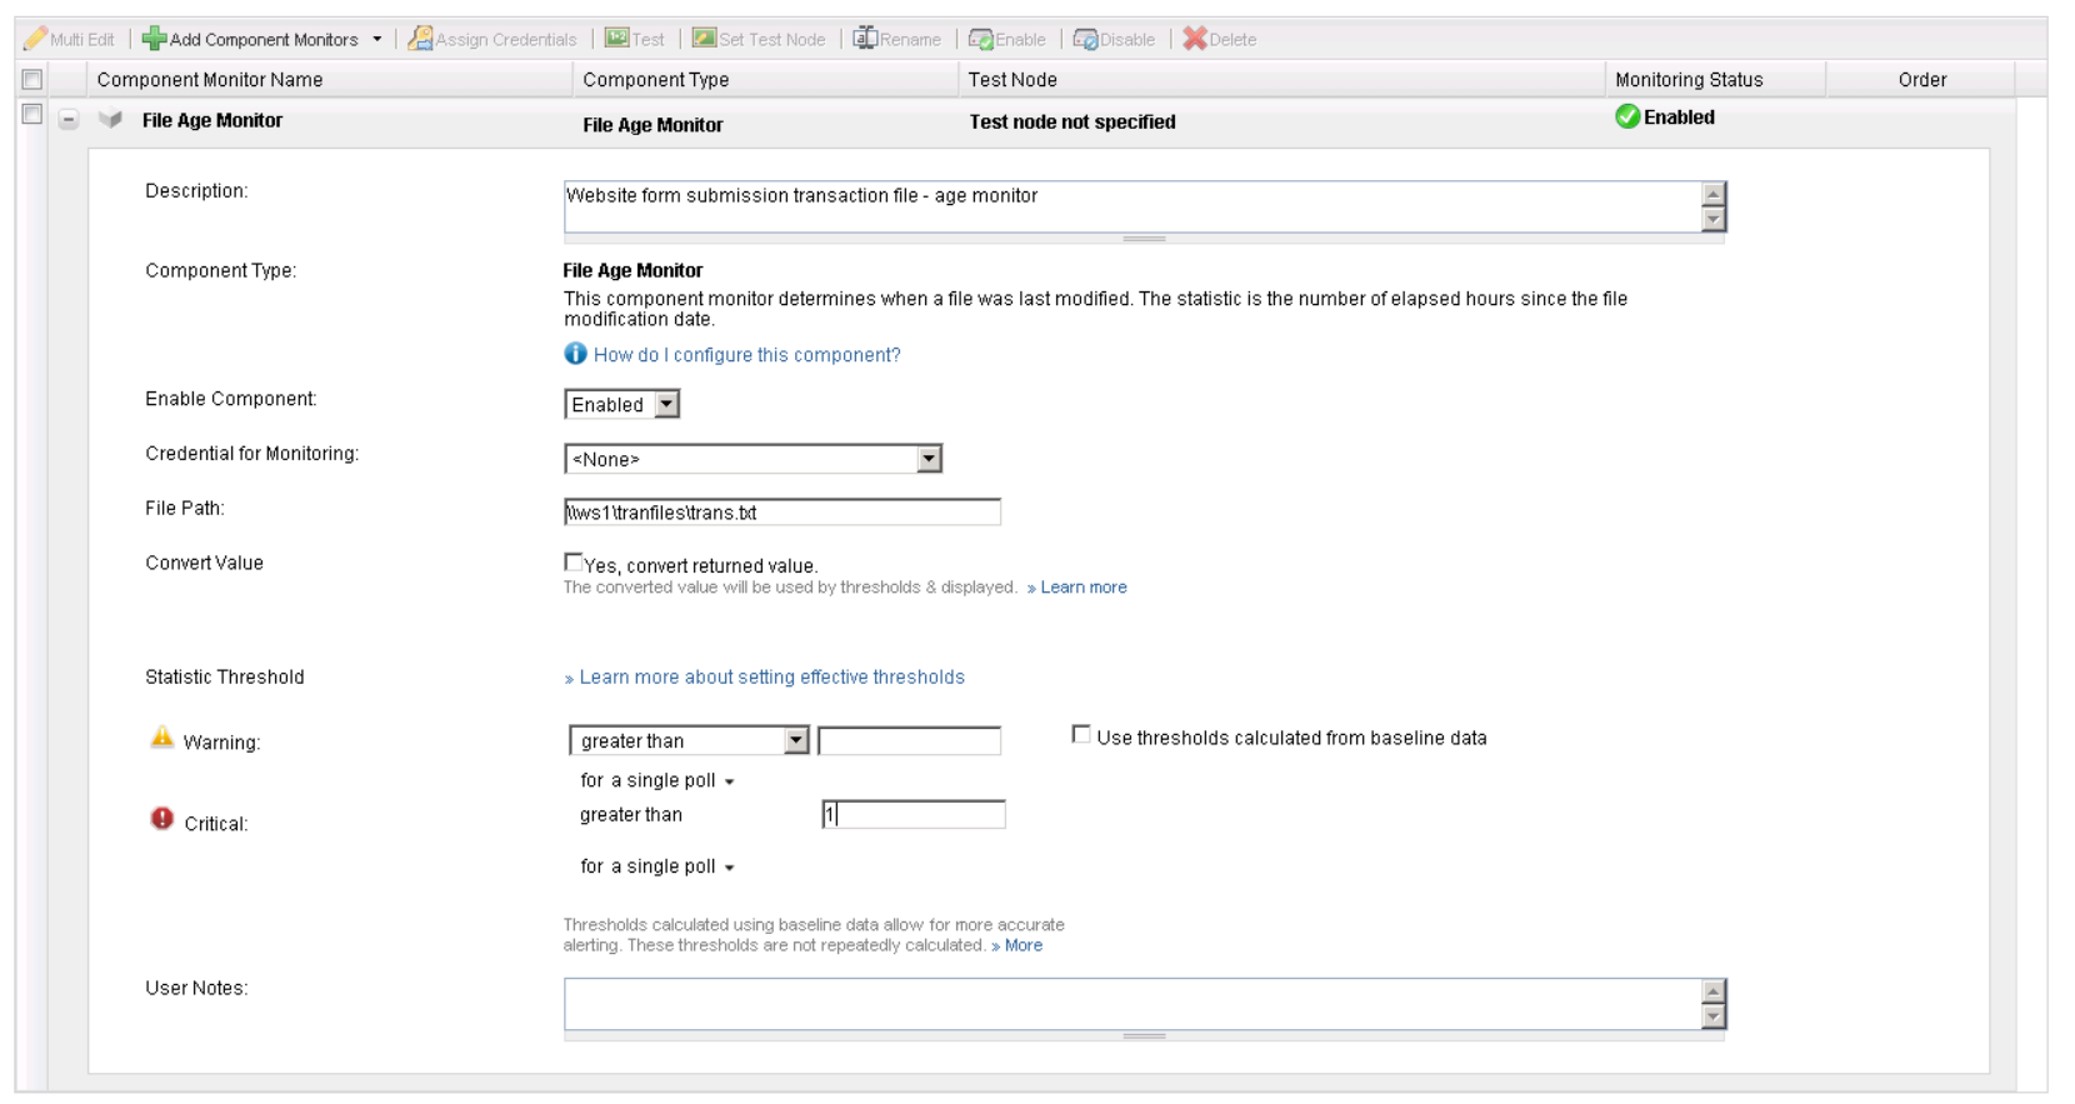
So in this case, I created a new “application” in SAM called “Website to CRM Integration” using one of the available templates. I setup the application to watch the event log for errors logged by our custom integration program – all I had to do was to specify the Application log, Error as the event type and choose my application as the source but I could have just as easily specified a range of Event IDs. But no news isn’t always good news – just because there aren’t any errors doesn’t mean the scheduled task is actually running. This particular process wakes up every few minutes and processes any transaction file that has been created by the web server since last check. If the file is there it processes all the entries and deletes it. So added a “File Age Monitor” that looks at the age of any transaction file. If the file gets older than 1 hour, I know that the process isn’t running correctly because it should process and delete any transaction file within minutes. I love this check! No matter what goes wrong, for whatever reason (network outage, schedule task logon problem, etc), if a transaction file is sitting around out there and not getting processed we’ll know about it.
Monitor Everything
I haven’t come up with a single situation yet that SAM can’t handle. We use it to monitor much more than logs and service status. The technical sources of data that SAM can monitor are called “component monitors” and the quantity and variety is a bit mindboggling You can check DHCP, query a web service, logon to a web site, run a database query, look for a process… the list goes on and on.
So now every time I realize I’m manually “checking” something I try to ask “How could I set this up in SAM?”
Positive Monitoring
The beauty of not just checking for actual positive results instead of just for errors or downed services is that, as in the example above, SAM can tell you whenever there is a problem with a given resource regardless of the problem. Then, by having both checks and troubleshooting information (e.g. event logs) grouped as “applications” SAM can instantly show you the available information for determining the cause of the problem. It’s so nice when you know about the problem before your users or customers do.
In support of that goal SAM offers a variety of “user experience” monitors which we need to make more use of. These monitors simulate operations end-users are routinely performing and alert you as soon as response time or availability issues are detected.
System and Virtualization Monitoring
As soon as I added my Windows servers as nodes, SAM immediately alerted me to some serious issues on several servers that I wouldn’t have discovered until real problems had developed. It doesn’t take rocket science to detect volumes low on disk space but who has the time to check that manually? SAM did this immediately and automatically for me.
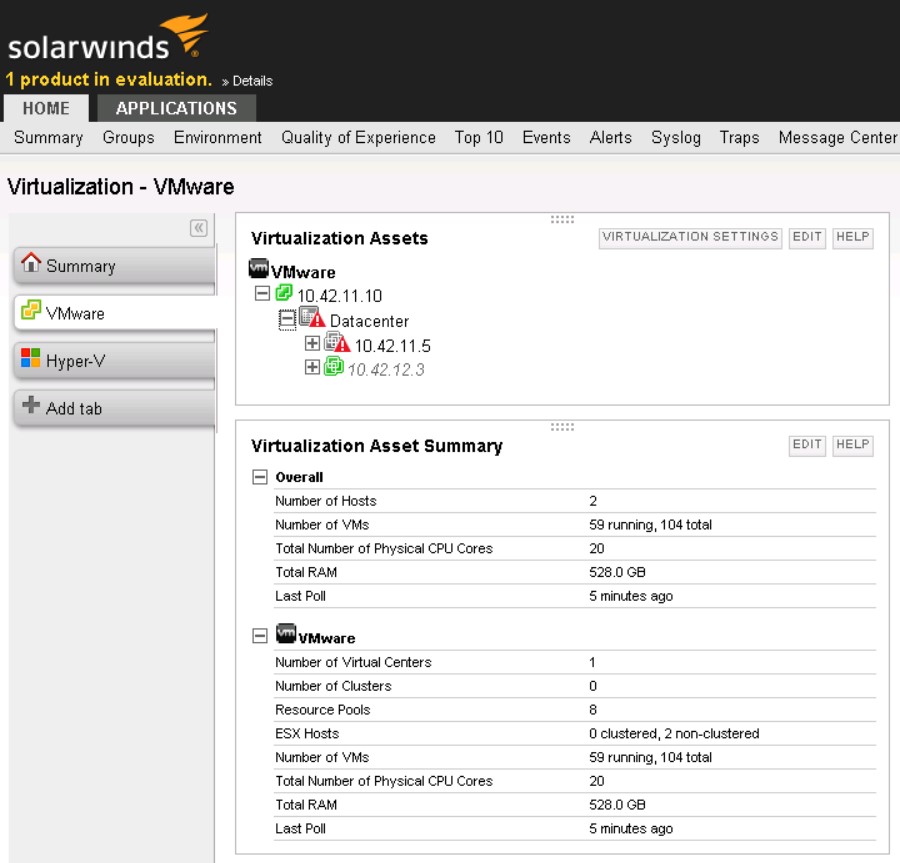
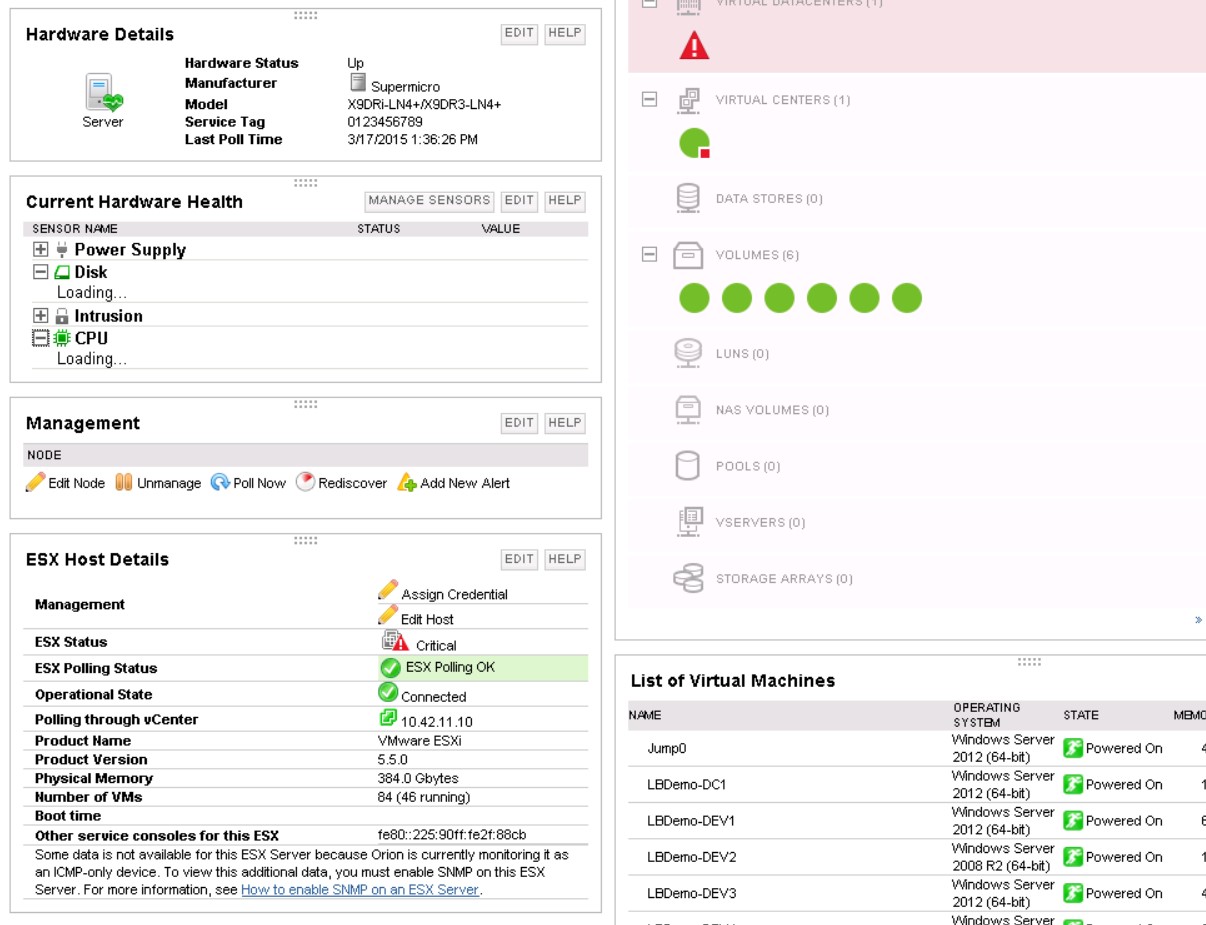
However, I was surprised that the Hardware dashboard remained empty. But then I added my VMWare vCenter server as a node and enabled virtualization monitoring. Then, wham! The hardware dashboard populated and it made sense. SAM was smart enough to realize that all my Windows servers were VMs and had no real hardware. But as soon as it started monitoring vCenter it discovered my 2 ESXi hosts, queried their hardware status and populated the dashboard. What blows my mind is that SAM can aggregate hardware status info from ESXi, Windows and Linux and other platforms and aggregate it all in to one dashboard. Now if I could just start monitoring the coffee maker like all those startups flush with venture capital to spend on critical tasks like that.
Another way SAM’s virtualization support surprised me is how it recognizes a virtual machine in VMWare as the same thing as a Windows Server node that it is monitoring directly. I haven’t drilled down into how it’s doing that but I’m impressed.
We’d been experiencing general slowdown in our virtualized environment and thought it might just be related to growth. But SAM gave us the visibility and freed up time to figure out that the slowdown was caused by weird stuff our cloud based AV solution was doing since the vendor had been acquired and they’d attempted to migrate our systems to their new agent. What a relief!
In the future I’ll try to write about SAM’s many other features like it’s Top 10 dashboards, server warranty monitoring, AppStak Environment , Network Sonar Discovery, AppInsight, geo maps and so on. In the meantime I encourage you to try out Server and Application Monitor. You can download a trial or just browse over to the interactive demo and instantly start playing with SAM at http://systems.demo.solarwinds.com/Orion/SummaryView.aspx