Live at RSA: Stopping Key Logging and Screen Scraping
Thu, 23 Apr 2015 10:43:55 GMT
As you know I view compromised user endpoints (aka
workstations and laptops) as the biggest risk facing us today. And that’s why I love application control
(aka whitelisting) from UWS sponsors like (Lumension and
Bit9+CarbonBlack). But there’s one
single silver bullet – defense-in-depth right?
One of the scary things bad guys can do once they have code running on
your user’s endpoint is log key strokes, change your keystrokes and record (aka
scrape) your screen – and even potentially re-write your screen. So it was cool
when, while wondering the booths at RSA 2015 I met Mark L. Kay, of StrikeForce Technologies, who
is a kindred soul on this concern. Their
GuardedID software is designed to prevent “malicious keylogging programs by
encrypting every keystroke at the point of pressing the keys, and rerouting
those encrypted keystrokes directly to your Internet Explorer browser through
its own unique path”. The products
appear to be targeted primarily at consumers but Mark told me they do have
enterprise customers and their website does have an Enterprise section showing
how to deploy GuardedID by group policy.
If you are at RSA 2015 check them out at booth 1227 in the South Hall.
 email this
•
email this
•
 digg
•
digg
•
 reddit
•
reddit
•
 dzone
dzone
comments (0)
•
references (0)
Related:
5 Indicators of Endpoint Evil
Auditing Privileged Operations and Mailbox Access in Office 365 Exchange Online
Severing the Horizontal Kill Chain: The Role of Micro-Segmentation in Your Virtualization Infrastructure
Anatomy of a Hack Disrupted: How one of SIEM’s out-of-the-box rules caught an intrusion and beyond
Live at RSA: FIDO authentication protocols and checking in real-time for user presence
Thu, 23 Apr 2015 10:30:32 GMT
There are a LOT of authentication companies at RSA 2015 this
year. It’s been fun learning the
difference between them – and there are big differences.
Arshad Noor from open source company StrongAuth (South Hall booth 2332), came
by the UltimateWindowsSecurity.com booth (South 2240) and briefed me on the
relatively new FIDO (Fast IDentity Online) authentication protocols. FIDO protocols are interesting for a lot
reasons but what Arshad said about “user presence” got my attention. One of my top concerns is how a compromised
user endpoint can effectively defeat even the strongest authentication
schemes. (2 Factor, SSO, Federation and Cloud Identity are Awesome
but it’s all for Naught if You Leave this One Backdoor Open ) If your endpoint is compromised, malware
can wait until you authenticate and then piggy back off that authentication
using a host of different methods. So
you have to attack that on 2 different fronts: preventing malware and for
really high value operations you need to get reassurance at that moment in time
that the user is present and the one initiating that operation. Just checking for user presence still doesn’t
solve for every sophisticated scenario but it gets you a lot closer. But as with all things security, if you
aren’t careful you end up making things so inconvenient for the user that you
get in the way of business and asking users to go all the way back through
onerous authentication steps at seemingly random times is a great way to get in
the way of business. So that’s why
Arshad got my attention when he mentioned “user presence”.
FIDO makes it easy for an application,
including web applications, to reach out to the users FIDO compliant token and
ask for real-time user presence verification.
It’s up to the token vendor how to implement this but the example Arshad
talked about was a simple token started flashing and LED. All the user has to do is touch the token to
say “yes, I’m here and initiating this transaction”. Then the token signs the verification
response with its private key tied to that application and user and sends it back to the server. That’s got to be the
lightest weight 2nd factor user presence check I’ve seen. I’ll be talking a lot more about the risks at
the intersection of authentication and endpoint security but if you’d like to
learn more about the FIDO protocols visit the FIDO
Alliance.
email this
•
digg
•
reddit
•
dzone
comments (0)
•
references (0)
Related:
5 Indicators of Endpoint Evil
Auditing Privileged Operations and Mailbox Access in Office 365 Exchange Online
Severing the Horizontal Kill Chain: The Role of Micro-Segmentation in Your Virtualization Infrastructure
Anatomy of a Hack Disrupted: How one of SIEM’s out-of-the-box rules caught an intrusion and beyond
Live with Duo Security at RSA 2015
Thu, 23 Apr 2015 10:11:16 GMT
Duo Security is a cloud-based 2-factor authentication
service that I’ve been following for some time.
I sat down with Ash at the UWS booth here at RSA. (#2240 South Hall). Here's the #1 thing you need to know about Duo Security. It's the easiest and fastest 2-factor authentication solution I've seen. Here’s some highlights of our discussion
about some of the cool things I like about Duo Security and their new Platform product.
Duo Security is close by at #2345 in the South Hall.
(Transcript below video)
Randy Smith:
Ash, Randy Smith here.
Ash: Hi, Randy it’s good meeting you.
Randy Smith:
Yeah, I’ve got Ash here at the Ultimate
Window’s Secruity.com booth here at RSA. Ash is with DUO Security. I don’t know
if you’re familiar with DUO. I wanted to talk to you guys because we’ve
actually been using DUO security as one of our authentication solutions for
quite awhile. And I don’t want to steal your thunder but what I love about it
is that it’s service based. It’s just a token that runs right on your smart
phone and it’s so easy to install. Alright,
so anyway, like I said, I think it’s a neat solution, but how did you get
started? Let me let you put it in your own words, what makes you different from
a lot of the other solutions out there?
Ash: Sure, so a couple of things. By the way, thanks for having me here. We do two factor authentication and that’s
what the company started as almost five years ago. What we did is take this very reliable two
factor authentication security control and make it radically easy. So when you request
for a two factor authentication people are used to typing in a six digit number
and typically get a SMS or hardware token. We took that away and the end user
gets something like this… a push notification. All the end user does is hit the
green button, right? If it’s not the
authentication they are requesting for they hit the red button. That’s all they
do and boom you’re in. It looks very
easy in the front end but in the back end it’s really secure. When they hit the
green button, they’re actually signing with their private key on the device and
telling them, “Yes, this really me.” So that’s what the company really started
with almost five years ago.
Randy Smith:
The other thing I love is there’s
nothing to install except the agent, if you call it that, maybe you have a
different word that you prefer. Put the agent on each server you want to control
access to. So whether we are using it
for our terminal services remote access or different servers for remote
desktop. Also we’ve got it integrated into the back end of our website, but
that’s all there was to install. Everything else we manage from the cloud.
Ash: That’s absolutely right, Randy. A lot of our
customers get the whole department up and running in three or four hours or
less than 4 hours. We have cloud based that allows us to do this. We even have
something called the “DUO five minute challenge.” If you Google for it you’ll
find it. It tells you how to get DUO up and running in less than five minutes.
You know, we take pride in that but I think it’s one of those secure controls
that you want to get up and running as fast as possible.
Randy Smith:
So what is it again that you support?
Ash: We support all VPNs: Cisco, Juniper, FI. We
support RDP from Microsoft. We also support a bunch of web applications. Also a
bunch of product applications like Office 365, Google and Google applications,
Amazon AWS and so on. Recently we also started supporting all the SSO. If you
are using something like OneLogin or Ping or Autha then we work out of the box
with all of these as well.
Randy Smith:
So, but, you’ve got this new thing
“platform”. What’s that?
Ash: Yep. So platform is a new addition that we
launched last week, we’re very excited about it. It takes us beyond 2FA in
securing access. It’s kind of a cliché when you say we secure access for any
device and any user or any application but that’s really what we’re doing. So
some of the functionality that you get is without installing any agent or any
MDM on your mobile device, you can get visibility into on one or all of the devices
our users may have. Are they IOS devices or are they Android devices and what version
of it? Are they jail broken? Are these free login phones. It’s kind of a mobile compliance without installing
a MDM agent. You can also secure access to cloud through policy and control. A
typical thing is I want to block users from China logging into my Salesforce.com
and you can set that up just by click of a policy down.
Randy Smith:
So you are able to leverage the fact
that you already have an app running on that device so you can do more than
just ask the user is it okay to log on.
Ash: That’s absolutely right. You know, one thing
that a lot of people do not understand is that the kind of API’s, IOS and
Androids have and the kind of querying and control you can do just through the
API’s. We no longer live in the world of Windows XP where you need an agent for
everything. So the app we have on the device talks through the API that does
all the querying. These are API’s that were released like ten months ago. So
we’re taking advantage of all the API’s and eliminating the need of a ticketing
agent or an MDM agent and just doing the right security stuff on the device.
Randy Smith:
Alright, well I’m going to be real interested
to see what you can do with that. Well,
cool. Thanks. It was nice to meet you and we’re looking forward to learning
more about your platform.
Ash: Be sure to look on duosecurity.com Thank
you.
email this
•
digg
•
reddit
•
dzone
comments (0)
•
references (0)
Related:
5 Indicators of Endpoint Evil
Severing the Horizontal Kill Chain: The Role of Micro-Segmentation in Your Virtualization Infrastructure
Auditing Privileged Operations and Mailbox Access in Office 365 Exchange Online
Anatomy of a Hack Disrupted: How one of SIEM’s out-of-the-box rules caught an intrusion and beyond
Best Practices Primer for Managed File Transfer
Wed, 22 Apr 2015 17:02:46 GMT
- Why managed file transfer matters
- The basics of file transfer security and compliance
- How to improve IT agility with managed file transfer automation
- Key requirements for managed file transfer solutions
Download now or get your signed copy at booth 2138 South Hall at RSA 2015.
email this
•
digg
•
reddit
•
dzone
comments (0)
•
references (0)
Related:
5 Indicators of Endpoint Evil
Auditing Privileged Operations and Mailbox Access in Office 365 Exchange Online
Cracking AD Passwords with NTDSXtract, Dsusers.py and John the Ripper
Virtualization Security: What Are the Real World Risks?
Live with LogRhythm at RSA
Tue, 21 Apr 2015 16:03:25 GMT
Dave Pack from LogRhythm dropped in
to see me at the UltimateWindowsSecurity.com booth (come see us at booth 2240 South hall)
booth here at RSA. As you know LogRhythm
has been sponsoring my real training for free webinars for many years and is
one of my favorite SIEMs so I thought I’d do a quick interview to see what’s
new at LogRhythm.
Video transcript:
Randy: Alright, so we’re live here at RSA at the
UltimateWindowsSecurity Booth and I got David Pack here. We’ve done a lot of webinars together in the
past on the Windows Security log. LogRhythm has got an awesome SIEM. You know how much I love it for a number of
reasons. So what’s new? What are you guy’s doing? What’s some big stuff?
David: Yeah, so what we’re really focusing on is
building a workflow to handle the full threat life cycle.
Randy: Ok.
David: You know, everything from that initial
detection to providing the tools to validate and qualify the detection, moving
it into case management where evidence can be gathered and you know, a true,
full picture of the story be put together and then ultimately adding on
automated response actions to that. You
know, the whole goal is to lower the time to detect these events and then also
lower the time to respond to these events, get them identified and cleaned up
as quickly as possible.
Randy: So, you know, what is that that you’re
doing? Are you building, you know, I can
take notes and I can add stakeholders to this incident and document what is my
resolution?
David: That’s right.
It’s a fully integrated case management feature within the SIEM and you
know, the workflows are, you can add evidence, different types of
evidence. It could be log data, it could
be raw logs, it could be attachments, it could be notes. Add different collaborators in. You could get to the case from a URL where
you add an external collaborator that doesn’t actually have an account with a
log in. You might need HR to come do one
specific task. You can add them and then
do their task and move on.
Randy: Yeah, because what if you’ve got a company
that is already using another collaboration tool, like, I hate to use other
product names while I’m interviewing a good sponsor friend, but you know, like
Asana, Wrike, because you know we are looking at using that kind of stuff, but
that’s cool you could just create a new task or project over there if there’s
other stakeholders that you don’t want in your SIEM.
David: That’s right.
Randy: And just put that URL there.
David: Yeah, and there’s an API to integrate and
some integration in the works with some of those other popular ticketing and
case management type systems that are out there. So we kind of understand we
need to play well with other solutions.
This is really supposed to be the start at least of that threat
management life cycle.
Randy: I like that.
So instead of just hey there’s something you need to look at and then
you’re on your own. We’re going to
facilitate the whole process because that’s really only the beginning, the
alert in the SIEM or that light on the dash board, really that’s just beginning.
David: That’s right.
What we were seeing, a lot of people were dropping alerts or you know,
they’d start working on one and got pulled away to do something else, came back
and a different alert may have came in and that initial one kind of was forgot
about, so they didn’t really have a place to, alright let’s start a case here,
formal workflow, formal collaborators, a place to gather other types of
evidence and workflow and pull it all together.
Randy: I
like it. What about knowledge
management. Do you still work in the
knowledge engineering area?
David:
It’s LogRhythm
Labs.
Randy: So,
I’m always interested in that because obviously what built UltimateWindowsSecurity
and what my folks, my audience is always interested in is how do we interpret
log data and you guys have made such a big investment over the years with a
whole department devoted to getting that knowledge and codifying it inside a
log rhythm. So, I’m always interested in
hearing what’s new there.
David: So
that’s still happening. That’s just an
ongoing investment, you know, we write all the parsing and normalization
rules. That’s really what enables our
real time analytics engine to do its job, basically adding structure to all its
log data. So that’s an ongoing thing,
something we always do for everything that can generate a log out there. The other half of LogRhythm
Labs is really focused on the security analytics, the actual analytic rules
that are finding bad things that are happening.
So one of the things we’ve recently done is developed what we call a
security analytics co-pilot service where we will help organizations get these
analytical modules properly deployed in their environment, up and running. We will have periodic check-ins to help them
understand what is the meaning when this alert fires. We’ll give them some recommended actions to
take. Okay, you might want to joule down
on the impacted hose and then pivot off to this user and really kind of be
their analytics co-pilot, help them get the most they can out of all the
content that Log Rhythm Labs is producing.
Randy: That’s cool.
You know, the fact that you guys, I know that I always harp on this, but
it’s still, I think, core to what makes LogRhythm
what it is and it’s the normalization and categorization, but here’s the thing
that always gets me. Alright, parse as
many log sources as you can, but when you come up with a threat signature, you
don’t have to write that threat signature for every log source out there that
produces those kind of events, right?
David:
That’s right.
Randy: Can you just explain how the fact that the
events are normalized allows you really write that threat signature criteria or
rule one time?
David:
Right, so you know, so all of these rules are basically working against the
normalized layer of data, LogRhythm
terminology.
Randy: A
log on is a log on is a log on.
David: A
log on is a log on. Every log that comes
through the system is identified and what we call a common event, where a log
on is a log on regardless of the operating system or the application. So the rule might say, you know, X number of
failed logons followed by logons, so classic use case, but because we’re
normalizing everything across the board, it works against everything.
Randy: Yeah, yeah, that’s cool. Well, I love that. I also love the fact, let me just put a plug in
for my software company LogBinder. You guys have integrated and normalized the
events that our software LogBinder
generates from SharePoint, SQL Server and Exchange right into the rest of
everything else that LogRhythm can
show you. And so, we’ve got some
customers in common that are using that to good effect.
David: Absolutely, yeah, yeah it’s great data for
SOC to have or an IT organization to have access to and it’s pretty difficult
to get to work without a product like yours, you know, working with a product
like ours.
Randy: Yeah.
David: It’s a great relationship.
Randy:
Some good synergy.
David: A
lot of good value there, absolutely.
Randy:
Alright, well thanks, I know you have to get back to your booth. Thanks for coming by, David.
David:
Thanks Randy. Thanks for having me.
If you are at RSA come see me at
booth 2240 in the South Hall and LogRhythm is at 1207 South hall.
email this
•
digg
•
reddit
•
dzone
comments (0)
•
references (0)
Related:
5 Indicators of Endpoint Evil
Auditing Privileged Operations and Mailbox Access in Office 365 Exchange Online
Severing the Horizontal Kill Chain: The Role of Micro-Segmentation in Your Virtualization Infrastructure
Anatomy of a Hack Disrupted: How one of SIEM’s out-of-the-box rules caught an intrusion and beyond
At the End of Day You Can’t Control What Privileged Users Do: It about Detective/Deterrent Controls and Accountability
Tue, 31 Mar 2015 17:19:33 GMT
Sudo is awesome and so is every other technology that helps you implement least privilege over admins. But at the end of the day you are just getting more granular with the risk but the risk is still here. Take a help desk staffer who needs to handle forgotten password resets for end users. Giving a privileged user like that just the authority she needs to get her job done is way less risky than giving her full root authority. But there’s still risk, right? If she is dishonest or becomes disgruntled she can reset the password of your chief engineer or CEO and access some heavy duty information.
So with any trusted user (whether a privileged admin or end user whose responsibilities require access to sensitive resources) you are ultimately left with detective/deterrent controls. You can’t prevent a user from trying to use whatever authority they have for evil but at least you can audit their activity. Ideally this gives you the chance to detect it and respond and at the very least it ensures accountability which is an important deterrent control. After all if you know everything you do is being recorded and subject to review, you think more than twice about doing something bad.
Besides being in control against malicious insiders, a privileged user audit trail is irreplaceable in today’s environment of advanced and persistent attackers. Such attackers actively try to gain privileged access so you also need the ability to actively monitor privileged user activity for quick detection of suspicious events.
In past webinars with BeyondTrust I’ve talked about how to use sudo to control what admins can do. In this webinar I’ll look at how to audit what admins do inside Linux and UNIX with sudo’s logging capabilities.
Click here to register now.
email this
•
digg
•
reddit
•
dzone
comments (0)
•
references (0)
Related:
Auditing Privileged Operations and Mailbox Access in Office 365 Exchange Online
5 Indicators of Endpoint Evil
Severing the Horizontal Kill Chain: The Role of Micro-Segmentation in Your Virtualization Infrastructure
Anatomy of a Hack Disrupted: How one of SIEM’s out-of-the-box rules caught an intrusion and beyond
How Randy and Company Do IT: Server and Application Monitoring
Thu, 19 Mar 2015 14:37:52 GMT
Note: This is part of an occasional series called “How Randy & Co Do It”.
We are a small but technology-heavy shop. We have a lot of servers, strict security requirements and a dispersed workforce. I also dabble and tinker a lot so because of that and other reasons our IT infrastructure is more complicated than most companies our size. My longtime sidekick Barry and I share responsibility for IT but we both have lots of other work to do so we try to set things up right and leave them alone. Nevertheless, things break and troubleshooting stuff can really kill our schedule and put us behind.
We needed something to help us keep a better handle on the status of our ever growing array of virtualization hosts, VMs, applications, VPNs, scheduled tasks and all the links between these components.
SolarWinds is one of our great sponsors and I’ve found them to be kind of a sweet spot in terms of IT tools with enterprise functionality yet with an SMB-size cost and complexity – perfect for us. So we worked out a deal with SolarWinds to try out their Server and Application Manager (SAM) and if it worked out well to share my experience. SAM is designed to help you “manage, monitor & troubleshoot application performance and availability”. We downloaded SAM early this year and here’s what we’ve found:
Installation
When you already don’t have time for troubleshooting the last thing you need is a trouble shooting tool that takes time to install and setup. SAM is a large download (close to a GB) but once you’ve got the file, it just installs – there’s no failed installs because of not having some version of .NET installed or whatever. If it isn’t there and SAM needs it, SAM installs it – including a built-in copy of SQL Server if you don’t have a SQL Server for handling SAM data.
Once installed, you just logon to the console and a wizard walks you through adding nodes for monitoring. Nodes are servers and other devices SAM can monitor. There are a number of ways to do this ranging from manual to automatic scheduled discovery of new nodes. I simply entered a range of IP addresses for my Windows servers to start out with and provided a domain credential. SAM automatically found all our servers. Then it showed the applications it automatically recognized on each server and allowed me to confirm them for monitoring.
Applications
That brings me to one of the features I really value about SAM and that is it’s concept of “applications”. SAM doesn’t just monitor systems, it also catalogs the applications found on each system and then automatically builds a dashboard that shows you the status of each installation of that application across all your servers. For instance, the SQL Server dashboard allows you to see how SQL Server is running across your entire network wherever it is running. This is a great way to look at your network instead of strictly in terms of each server and the apps running on it.
SolarWinds recognizes hundreds of applications out of the box and knows how to determine if the application is “up” which of course varies from one application to another. For instance, with SQL Server it knows each instance needs at least the main database service to be in the running state in order to count the application as up. SolarWinds aggregates all this status information into a pie chart so that you can instantly visualize the current status of each application across the entire network.
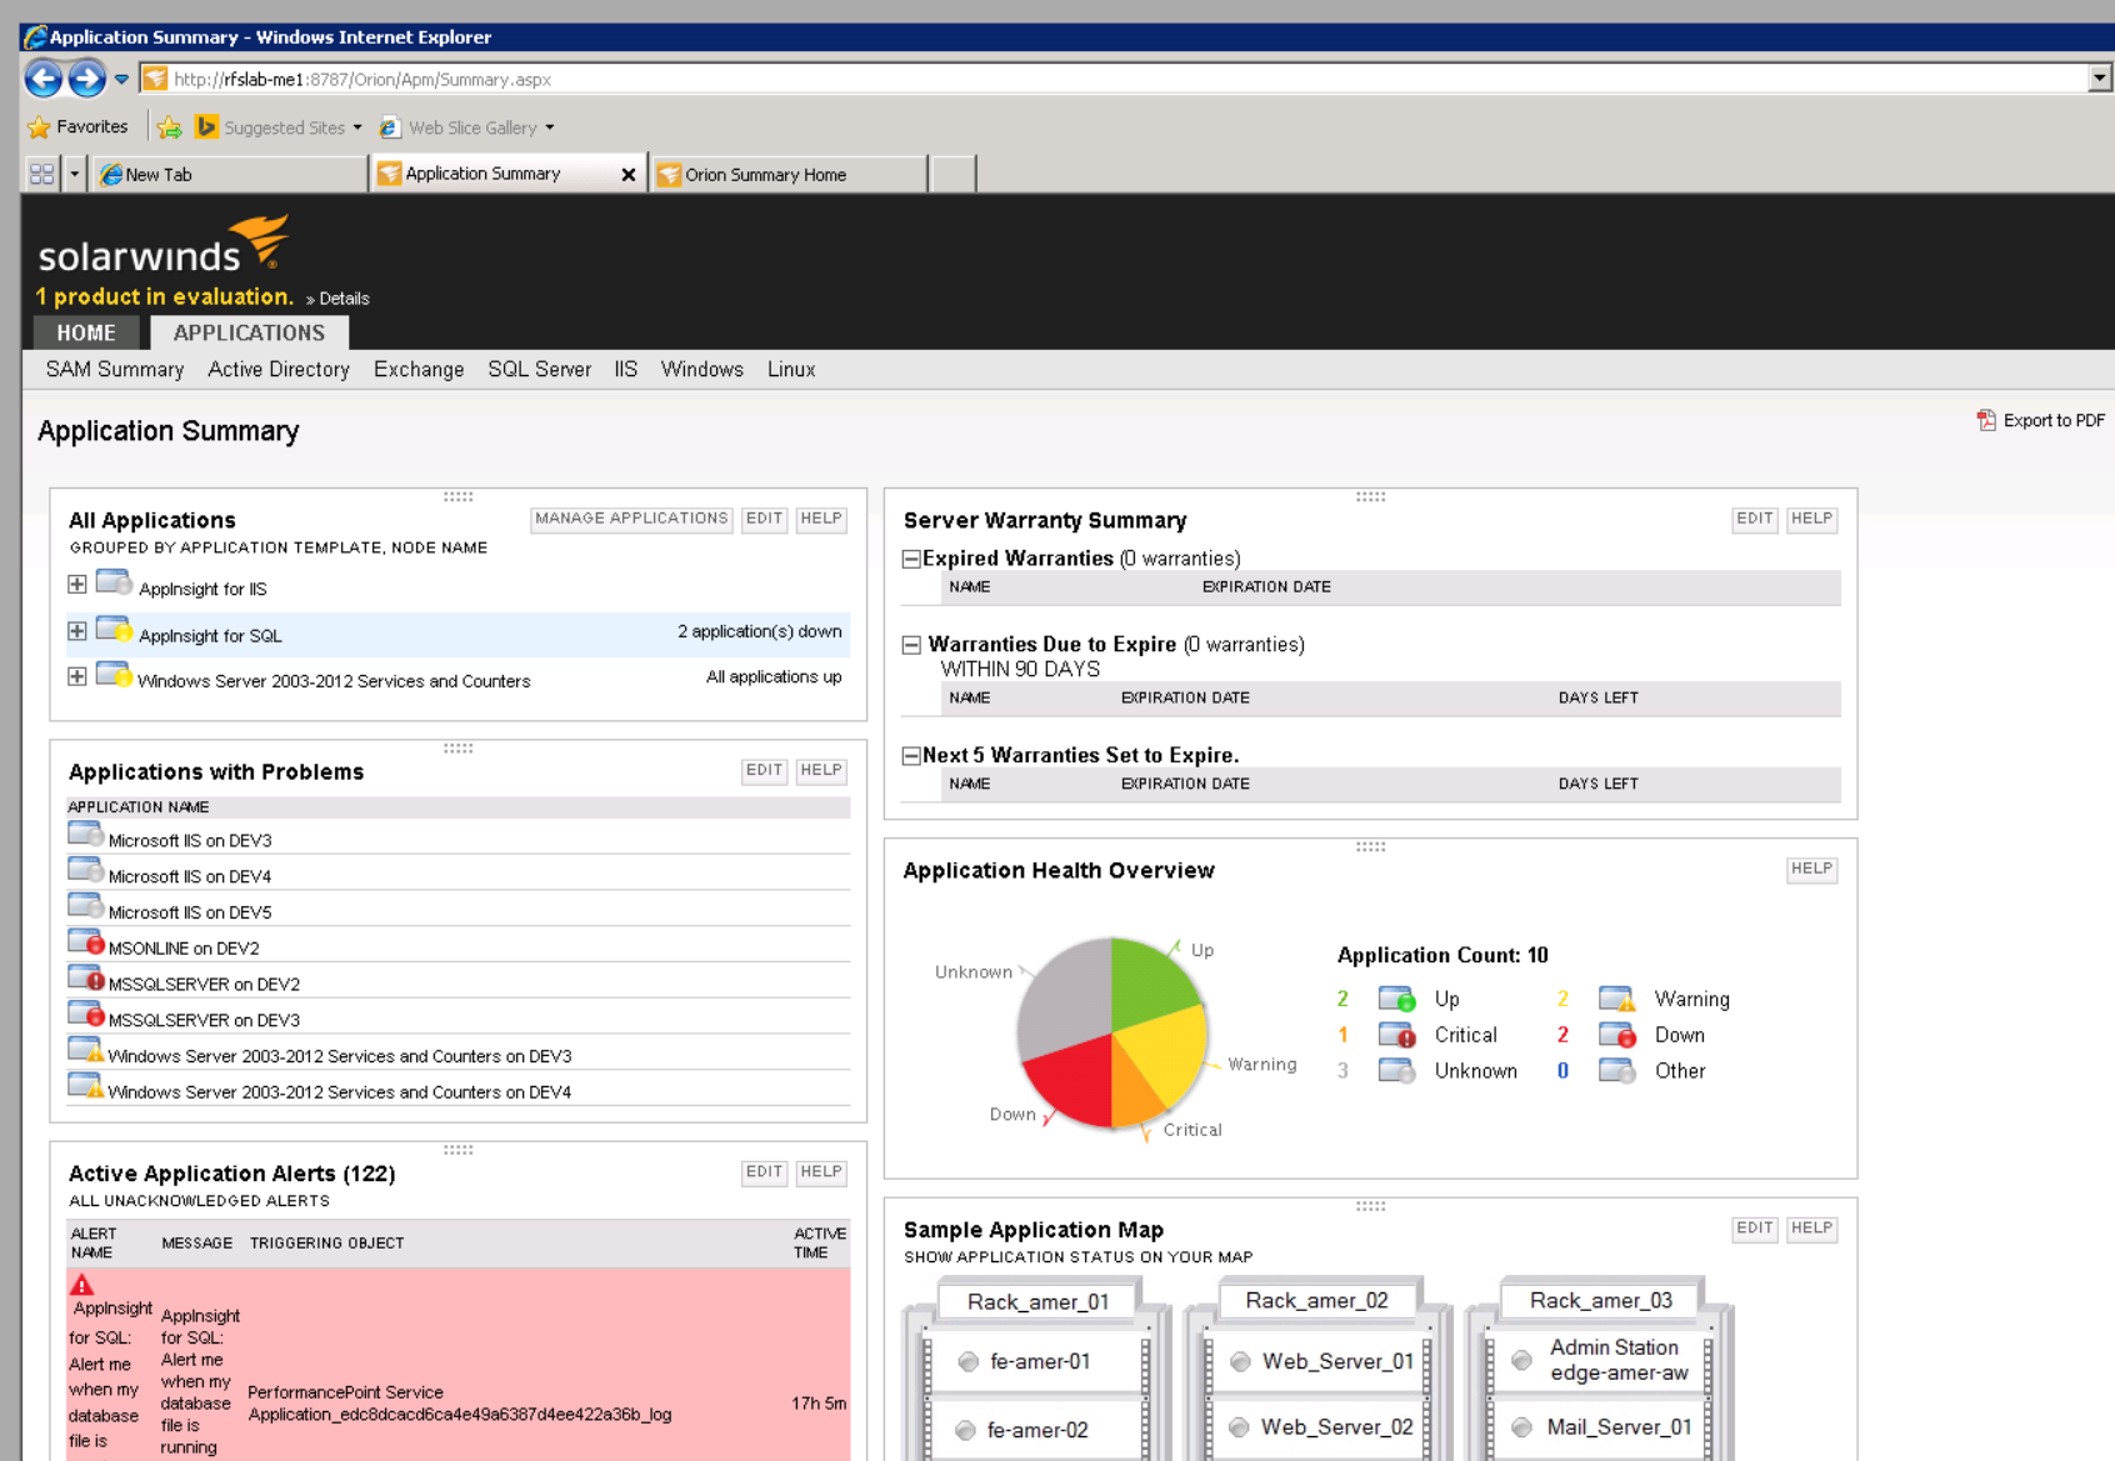
But there will always be applications that SolarWinds, or any other monitoring solution, doesn’t know about. For instance we have a scheduled task that runs every few minutes to move form submissions from our websites over to our CRM system. Normally I would have just created a monitoring rule to alert us if SAM sees any error events from that process. But it occurred to me that I should set this up as an Application in SAM. SAM can monitor anything (see below) you need to and you can group these monitors as custom applications which are then surfaced on dashboards side-by-side with the shrink wrapped apps that SolarWinds recognizes out of the box. At the top level, you can get a quick visual idea of the overall health of all applications and then drill down. For a given application you can see everything being monitored about it which may vary between many different data types such as:
- Service status
- Event logs
- Performance counters
- Response times
- File sizes
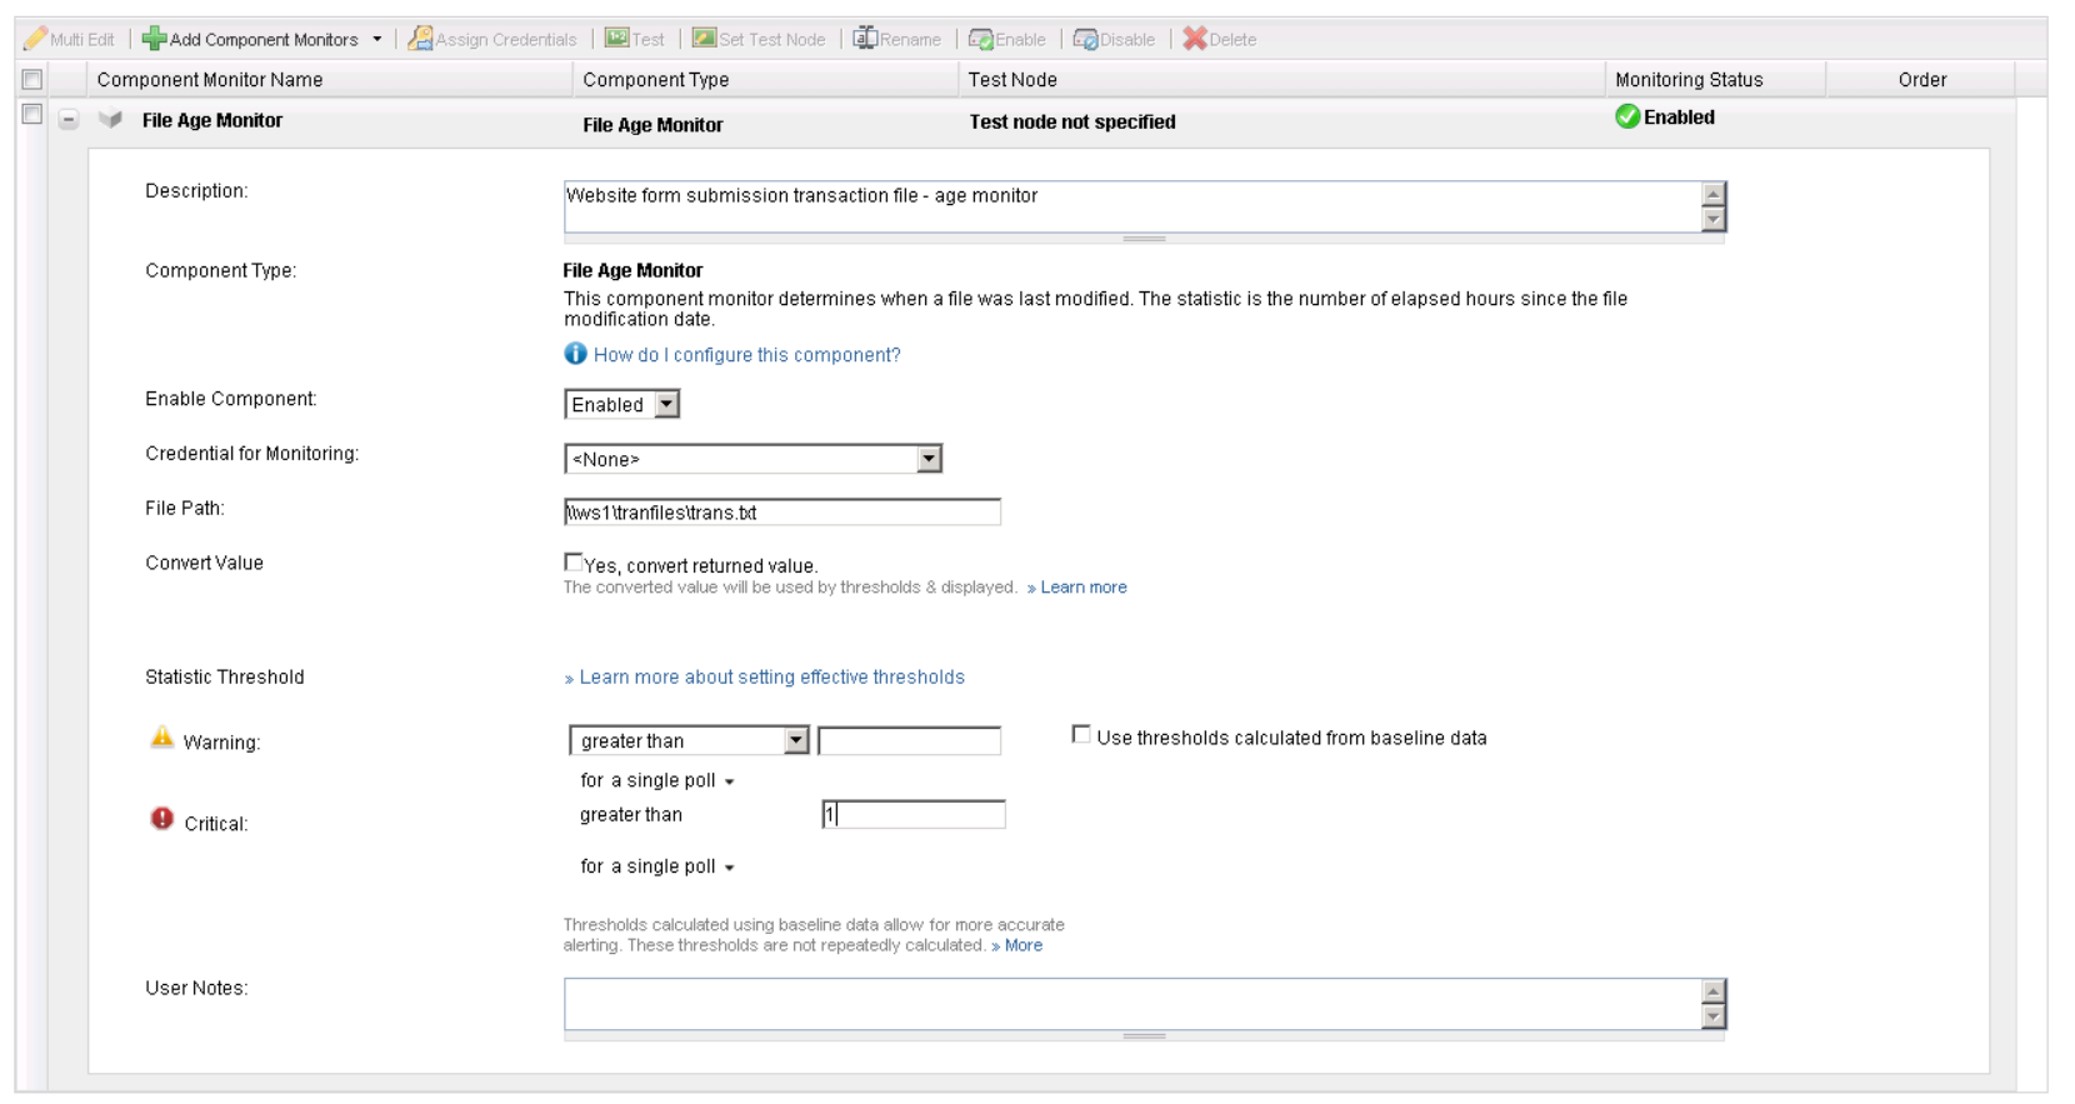
So in this case, I created a new “application” in SAM called “Website to CRM Integration” using one of the available templates. I setup the application to watch the event log for errors logged by our custom integration program – all I had to do was to specify the Application log, Error as the event type and choose my application as the source but I could have just as easily specified a range of Event IDs. But no news isn’t always good news – just because there aren’t any errors doesn’t mean the scheduled task is actually running. This particular process wakes up every few minutes and processes any transaction file that has been created by the web server since last check. If the file is there it processes all the entries and deletes it. So added a “File Age Monitor” that looks at the age of any transaction file. If the file gets older than 1 hour, I know that the process isn’t running correctly because it should process and delete any transaction file within minutes. I love this check! No matter what goes wrong, for whatever reason (network outage, schedule task logon problem, etc), if a transaction file is sitting around out there and not getting processed we’ll know about it.
Monitor Everything
I haven’t come up with a single situation yet that SAM can’t handle. We use it to monitor much more than logs and service status. The technical sources of data that SAM can monitor are called “component monitors” and the quantity and variety is a bit mindboggling You can check DHCP, query a web service, logon to a web site, run a database query, look for a process… the list goes on and on.
So now every time I realize I’m manually “checking” something I try to ask “How could I set this up in SAM?”
Positive Monitoring
The beauty of not just checking for actual positive results instead of just for errors or downed services is that, as in the example above, SAM can tell you whenever there is a problem with a given resource regardless of the problem. Then, by having both checks and troubleshooting information (e.g. event logs) grouped as “applications” SAM can instantly show you the available information for determining the cause of the problem. It’s so nice when you know about the problem before your users or customers do.
In support of that goal SAM offers a variety of “user experience” monitors which we need to make more use of. These monitors simulate operations end-users are routinely performing and alert you as soon as response time or availability issues are detected.
System and Virtualization Monitoring
As soon as I added my Windows servers as nodes, SAM immediately alerted me to some serious issues on several servers that I wouldn’t have discovered until real problems had developed. It doesn’t take rocket science to detect volumes low on disk space but who has the time to check that manually? SAM did this immediately and automatically for me.
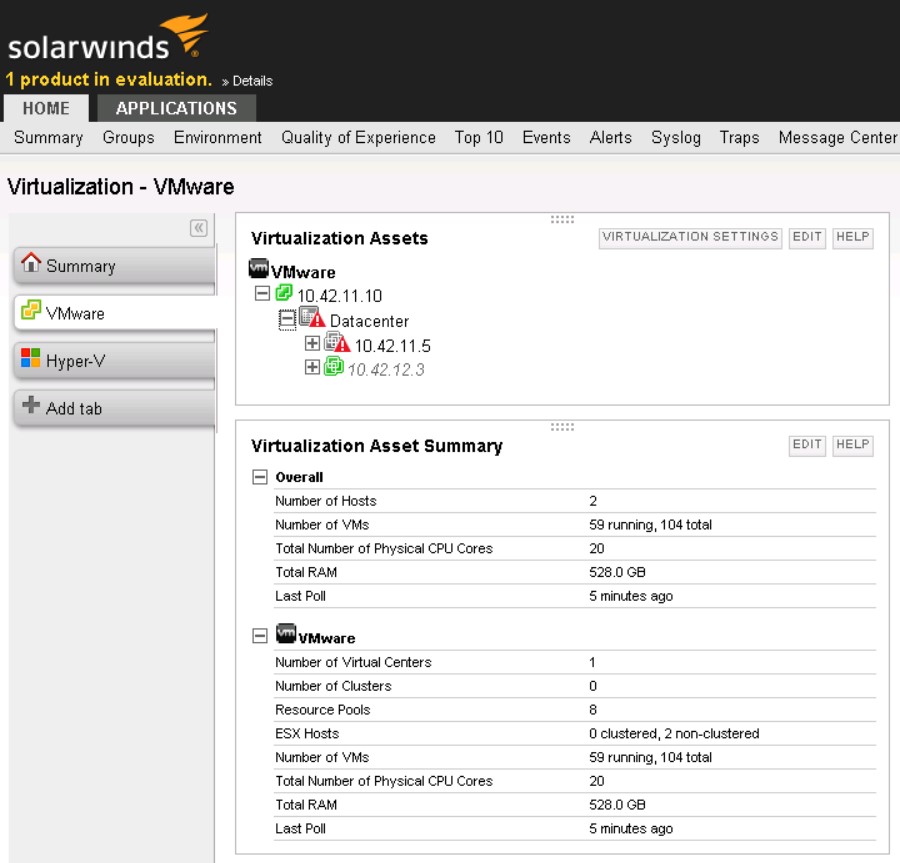
However, I was surprised that the Hardware dashboard remained empty. But then I added my VMWare vCenter server as a node and enabled virtualization monitoring. Then, wham! The hardware dashboard populated and it made sense. SAM was smart enough to realize that all my Windows servers were VMs and had no real hardware. But as soon as it started monitoring vCenter it discovered my 2 ESXi hosts, queried their hardware status and populated the dashboard. What blows my mind is that SAM can aggregate hardware status info from ESXi, Windows and Linux and other platforms and aggregate it all in to one dashboard. Now if I could just start monitoring the coffee maker like all those startups flush with venture capital to spend on critical tasks like that.
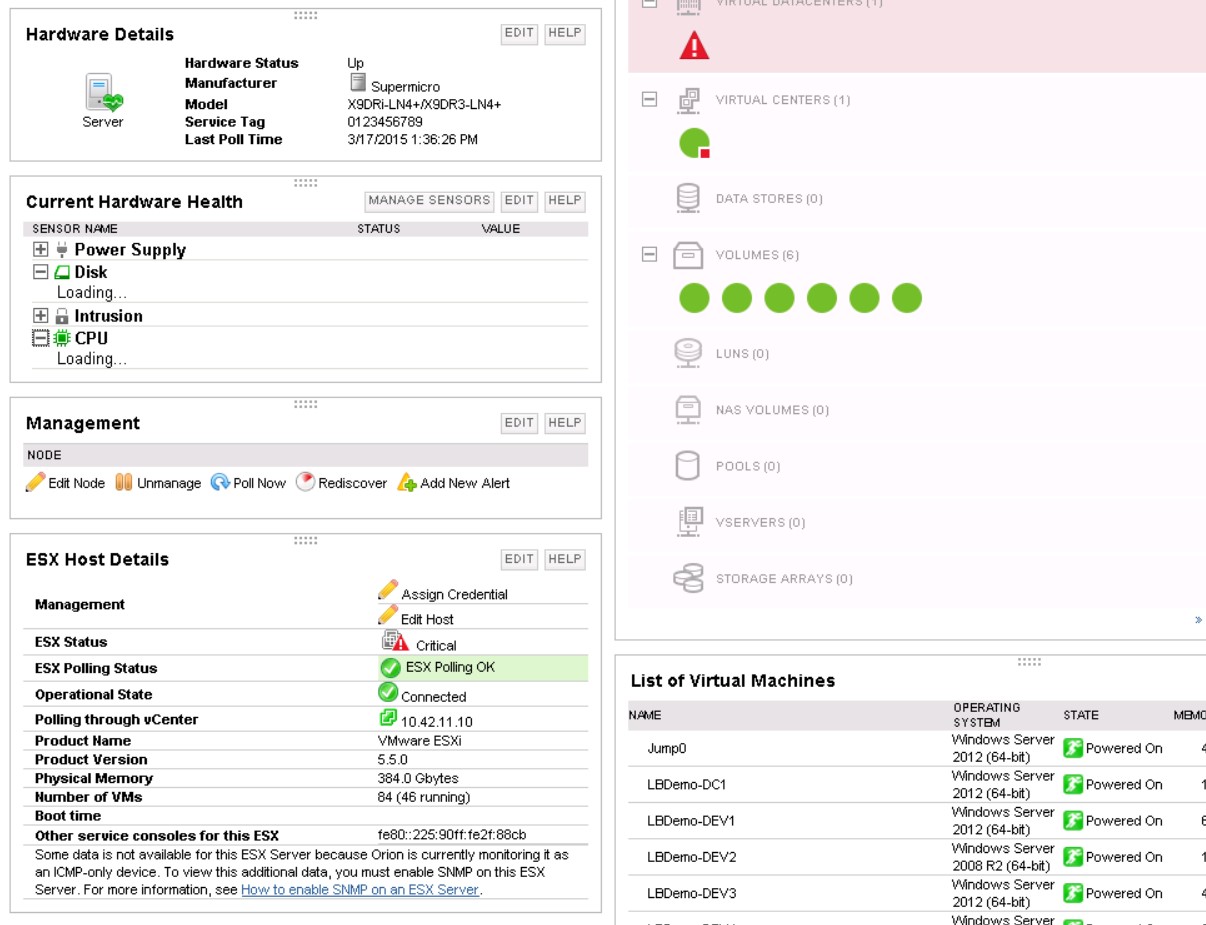
Another way SAM’s virtualization support surprised me is how it recognizes a virtual machine in VMWare as the same thing as a Windows Server node that it is monitoring directly. I haven’t drilled down into how it’s doing that but I’m impressed.
We’d been experiencing general slowdown in our virtualized environment and thought it might just be related to growth. But SAM gave us the visibility and freed up time to figure out that the slowdown was caused by weird stuff our cloud based AV solution was doing since the vendor had been acquired and they’d attempted to migrate our systems to their new agent. What a relief!
In the future I’ll try to write about SAM’s many other features like it’s Top 10 dashboards, server warranty monitoring, AppStak Environment , Network Sonar Discovery, AppInsight, geo maps and so on. In the meantime I encourage you to try out Server and Application Monitor. You can download a trial or just browse over to the interactive demo and instantly start playing with SAM at http://systems.demo.solarwinds.com/Orion/SummaryView.aspx
email this
•
digg
•
reddit
•
dzone
comments (0)
•
references (0)
Related:
Live with Dell at RSA 2015
Auditing Privileged Operations and Mailbox Access in Office 365 Exchange Online
Live with LogRhythm at RSA
5 Indicators of Endpoint Evil
Monitoring What Your Privileged Users are doing on Linux and UNIX
Tue, 17 Mar 2015 07:52:43 GMT
In previous webinars I showed how to control what privileged authority is in Linux and UNIX. With sudo you can give admins the authority they need without giving away root and all the security risks and compliance problems caused by doing so. But once you carefully delegate limited, privileged authority with sudo you still need an audit trail of what admins are doing. A privileged user audit trail is irreplaceable as a deterrent and detective control over admins and in terms of implementing basic accountability. But in today’s environment of advanced and persistent attackers you also need the ability to actively monitor privileged user activity for quick detection of suspicious events.
So in this webinar, I will dive into the logging capabilities of sudo. Sudo provides event auditing for tracking command execution by sudoers – both for successful and denied sudo requests as well as errors. Then I will show you how to enable sudo auditing and how to control where it’s logged, if syslog is used and more importantly: what do sudo logs looks like and how do you interpret them?
But sudo also offers session auditing (aka the iolog) which allows you to capture entire sudo sessions including both input and output of commands executed through sudo whether in an interactive shell or via script. I will show you how to configure sudo session logging and how to view recorded sessions with sudoreplay.
After my session, Paul Harper from BeyondTrust will show you how PowerBroker UNIX & Linux builds on sudo’s audit capabilities.
This will be an interesting and technical session.
Click here to register now!
email this
•
digg
•
reddit
•
dzone
comments (0)
•
references (0)
Related:
Auditing Privileged Operations and Mailbox Access in Office 365 Exchange Online
Severing the Horizontal Kill Chain: The Role of Micro-Segmentation in Your Virtualization Infrastructure
5 Indicators of Endpoint Evil
Live with Dell at RSA 2015
4 Fundamentals of Good Security Log Monitoring
Mon, 23 Feb 2015 11:17:54 GMT
Effective security log monitoring is a very technical challenge that requires a lot of arcane knowledge and it is easy to get lost in the details. Over the years, there are 4 things that stand out to me as fundamentals when it comes to keeping the big picture and meeting the challenge:
- Just do it
Sometimes organizations prevaricate about implementing a SIEM/log management solution because they aren’t sure they will be able to fully utilize it because of staff or skill shortage and a host of other reasons. Making sure someone is watching your SIEM and follow up on what it finds is certainly important but don’t let that hold you back from implementing SIEM and log management. There are multiple levels on the security monitoring maturity model and you can’t necessarily start off where you’d like to. But you need to be collecting and securely archiving logs no matter what – even if no one is looking at them at all. If you don’t capture logs when they are created you lose them forever; logs will only be there when you need them if you’ve at least been collecting and securely archiving them. That may be the first step on the maturity model but without it you lose accountability and the ability to conduct critical forensics to determine the history and extent of security incidents.
- Let your environment inform your monitoring
Security analytics technology like SIEMs is getting better and better at recognizing malicious activity out of the box. But there will always be a limit to what shrink wrapped analytics can find. At some point you need to analyze your environment and tailor your monitoring and alerting criteria to take into account what makes your environment different. How is your network divided internally as far as security zones? Which systems should be making outbound connections to the Internet? Which shouldn’t? Which PCs should be making administrative connections to other systems – which shouldn’t. Those are just a few examples. But the more local intelligence you build into your monitoring the better your SIEM will be at recognizing stuff you should investigate.
- The more secure and clean your environment – the easier it is to detect malicious activity
Here’s a couple examples of what I’m talking about. First a security example: let’s say you lock down your servers so that they can only accept remote desktop connections from a “jump box” you set up which also requires multi-factor authentication. That’s a great step. Now leverage that restriction by teaching your SIEM to alert you when it sees remote desktop connection attempts to those servers from unauthorized systems. APT and other malicious outsiders will likely be unaware of your setup at first and will trip the alarm. Here’s a cleanliness example. Let’s say you have a naming convent for user accounts that allows you to distinguish end user accounts, privileged admin accounts and non-human accounts for services and applications. If you strictly follow that convention you now have all kinds of opportunities to catch bad things as they happen in your environment. For instance if you see a non-human service account trying to logon interactively or via Remote Desktop you may very well have an insider misusing that account or an external attacker who has successfully ran a pass-the-hash attack on that account. Or if you see an administrative account created that doesn’t match naming conventions – that may be a tipoff of an APT creating a back-door account.
- Leverage a SIEM solution that is intelligent and automates as much as possible
If you are going to follow through on my #2 and #3 recommendations you need a SIEM that frees you up from doing all the obvious stuff that can be packaged by the vendor. EventTracker has been around a long time and has a huge amount of knowledge and support already built into it for many, many different log sources as well as intelligent behavior analysis.
Log monitoring is a rigorous, technical exercise but good SIEM technology frees you up to focus on what makes your environment different and how to leverage those differences to recognize malicious activity as it happens. But if you aren’t at the point to get truly sophisticated in your monitoring don’t let that hold you back from at least collecting and archiving those logs that they are secure and available.
email this
•
digg
•
reddit
•
dzone
comments (0)
•
references (0)
Related:
Understanding the Difference between “Account Logon” and “Logon/Logoff” Events in the Windows Security Log
Auditing Privileged Operations and Mailbox Access in Office 365 Exchange Online
5 Indicators of Endpoint Evil
Tracking Physical Presence with the Windows Security Log
NEW Free & Easy to Use Tool, Event Log Forwarder for Windows
Sun, 22 Feb 2015 22:13:47 GMT
Right or wrong, Syslog remains the de facto standard protocol for log forwarding. Every SIEM and log management solution in the world accepts syslog. So frequently you run into the situation of needing to forward Windows events via syslog. But Windows doesn’t support syslog and the “free” forwarders I’ve looked at in the past were just not pretty. Some even written in Java. Ugh. Besides being klunky and hard to configure they weren’t flexible in terms of which event logs they could forward much less which events within those logs.
But SolarWinds has just released a new and completely free Event Log Forwarder for Windows (ELF). ELF takes seconds to download, seconds to install and a minute to configure. Just select the logs you want to forward (below example shows successful and failed logons and process start events from the security log):
and specify the address of your syslog server:
ELF runs as a background service and immediately starts sending events out via syslog as you can see here on my syslog server.
I love how easy it is to filter exactly which events are sent. This allows you to filter out noise events at their source – conserving bandwidth and log management resources all the way down the line.
But what if you have many systems that need to be configured to forward events? I took a look at the folder where ELF was installed and found a LogForwarderSettings.cfg file that is very easy to read. Moreover there’s even a LogForwarder.PDF file in the Docs folder that fully documents this settings file. I don’t see anything installation dependent in this file so it looks to me like you could use the ELF GUI Client to configure one installation and then copy LogForwarderSettings.cfg to all the other systems where you want the same behavior.
You can download SolarWinds Event Log Forwarder here http://www.solarwinds.com/register/registrationb.aspx?program=20056&c=701500000011a71&CMP=BIZ-TAD-RFS-ELF_Review-ELF-DL-2015
email this
•
digg
•
reddit
•
dzone
comments (0)
•
references (0)
Related:
Auditing Privileged Operations and Mailbox Access in Office 365 Exchange Online
5 Indicators of Endpoint Evil
Severing the Horizontal Kill Chain: The Role of Micro-Segmentation in Your Virtualization Infrastructure
Anatomy of a Hack Disrupted: How one of SIEM’s out-of-the-box rules caught an intrusion and beyond
previous | next
powered by Bloget™