With so much focus on security these days, you’d
think IT would be winning the battle against malware and other threats. But all
too often,
a lack of focus on certain areas of the
network leads to a decrease in an organization’s security posture and an
increase in risk.
The endpoint is such an area. Endpoints have more
than the ability to reach beyond the protective layers of
internal security—they’re allowed to do so.
End user behaviors such as working from outside the office,
connecting to unsecured WiFi networks, visiting potentially dangerous websites,
and opening email with malicious
attachments or links all make endpoints a particularly
vulnerable attack vector with access to your organization’s network.
According to a recent Ponemon report 80 percent of
organizations are seeing web-born malware attacks. Sixty-five percent have
experienced rootkit attacks and 55 percent have encountered spear
phishing—all on a frequent basis.
And when malware and endpoints mix, the attack
doesn’t stop with a single infected machine. Rather, that first infection turns
the machine into what is commonly known as
a beachhead. From there, malware is
designed to spread laterally throughout your network, in an effort to maximize
the chances of obtaining valuable credentials or data.
Although your thoughts might immediately go to
attack mitigation and prevention, most organizations—a whopping 70 percent,
according to the Ponemon study—have difficulty enforcing endpoint security
policies.
Rather, detection is a key aspect of any
strategy. The best approach is to use the endpoint as a sensor, collecting
state information, understanding which behavior is normal, and identifying what
isn’t.
In this whitepaper, we focus on five trouble
indicators, each of which provides additional context around what to look for
on your endpoints:
- Rogue processes
- Evidence of
persistence
- Suspicious traffic
Activity and user-role mismatches
- Unusual OS
artifacts
For each indicator, we tell you what to look for,
as well as which tools you can use to identify and gather intelligence around
the malicious code that might be lurking within your endpoints.
Indicator #1: Rogue Processes
Successful attackers depend on their malware to go
undetected. After all, malicious remote administration tools (RATs) are
designed to provide access to the command prompt, file system, registry,
hardware, remote control, and more, with the purpose of
providing many ways to find, extract, hold hostage, or destroy your
organization’s critical information. If RATs were easy to find, the attack
wouldn’t stand a chance—so attackers use several methods to
obfuscate their presence.
Evil Methods
- Process looks
good … on the surface. The process name (such as explorer.exe) is
right, but the parent process, logon user, or file path is incorrect. You need
to look not just
at the process in question, but also at the process that
started it. If that process is not standard, it could indicate that the child
process is a rogue process. Another method that attackers use is
a clever misspelling of the file name. For example, a rogue
file might be named scvhost.exe instead of svchost.exe—a spelling that is so
close, you would probably need to compare file names to confirm the
misspelling.
- Suspicious DLL
execution. Dynamic Link Libraries (DLLs) contain modular code to help
support a main application. Attackers often take advantage of the fact that
parts of the core Windows OS heavily utilize DLLs:
- rundll32.exe. Known as a command
line utility program, rundll32.exe is responsible for running DLLs by invoking
a function that is exported from a specific 16-bit or 32-bit DLL module.
- svchost.exe. Svchost is a generic
Windows OS program that hosts approved Windows services. Malicious applications can be formed as DLLs
specifically made to work with svchost.exe and trick it into running
them.
- Other legitimate
processes. The use of DLLs is common, so rogue DLLs can also be
loaded into an otherwise benign application.
- Rootkits. These are nasty stuff.
By definition, they take advantage of administrative (root) access, embed
themselves into an OS, and then intelligently evade detection.
Regardless of the tactic used, the goal of rogue
processes is either to make the process look legitimate or to use a legitimate
process to launch a malicious DLL, making it more difficult to identify and
track via the security log.
Detecting Rogue Processes
Ideally, you have a centralized way to collect
relevant process information across your network and automatically identify
rogue processes—capabilities that are available via solutions like
EventTracker.
Here is the kind of analysis required to catch rogue
processes.
- Analyze event ID
4688. This event is generated each time a new process is created. The
event provides relevant information that you can use to identify rogue
processes. As Figure 1 shows, this information includes the name of the user
account that launched
the process, the date and time the program started, the
process ID, the parent (creator) process ID, and the full path of the process
executable.
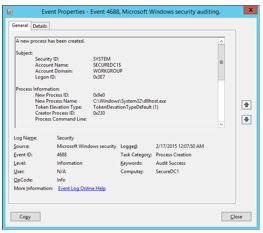
-
Note: Although this event shows
the Creator Process ID, there is no associated name or a full path to that
process, which is an important piece in determining whether a process is rogue.
The parent (creator)process can be determined by manually searching for an
earlier 4688 event with
a New Process ID that matches this Creator Process ID value.
After enabling Audit process
events via Group Policy, your endpoints will log a massive number of
events, so although this is a valuable way to get information, you’ll also need
to wade through a sea of data. Furthermore, the event is not generated when
DLLs are loaded, only when new processes are started.
So if the rogue process is a DLL hiding in a file such as
svchost.exe, the event logs won’t contain any clue that it was invoked.
However, after you identify something amiss on a given machine, memory
forensics tools such as those from the Volatility Foundation
can
help provide further forensics detail when DLLs are injected
or rootkits installed.
- Check for
unsigned code/Malware and viruses are often attached to legitimate
executables from known or somewhat known entities. Program files that are
signed declare the publisher and confirms that has not been modified by an
attacker. Since unsigned files don’t have this assurance, unsigned code
might indicate potential malware – you just can’t tell. Note
that Windows 8 and earlier default to allowing unsigned code to run.
Several tools can audit and analyze running
processes on a machine. Although not enterprise-caliber tools, these can be
useful in tracking down issues on a per-machine basis:
- Check programs
against the National Software Reference Library (NSRL). This library
(available at http://www.nsrl.nist.gov) is a joint effort between the U.S.
Department of Homeland Security; federal, state, and local law enforcement; and
the National Institute of Standards and Technology (NIST) to collect software
from various sources and incorporate file profiles into a reference library to
be used in the investigation of crimes involving computers.
At the end of the day, the trick to detecting rogue
processes is to know what should and should not be running on your Windows
endpoints. If you’re using a golden image, this exercise should be relatively
simple: compare the running processes with a known list. But if every machine
is somewhat different, you might need to start with a basic list of what should
be running and then use the methods here to detect what falls out of the
norm.
Detecting Rogue Processes with
EventTracker
Even with the appropriate auditing policies turned
on, you will need to do a fair amount of detective work to get a complete
picture of which processes are running and whether they are rogue.
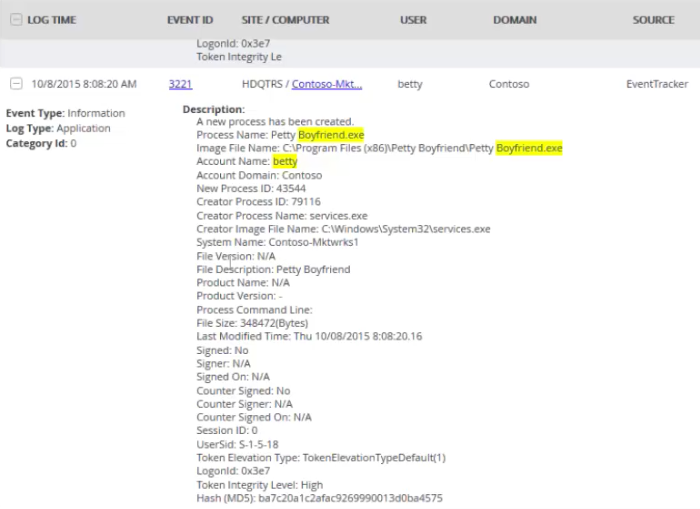
EventTracker’s sensor collects pertinent information—including process, file,
creator, hash, and signer details—and intelligently present it as a single
event, as shown in Figure 2. This approach creates centralized details that are
easily available for security information and event management (SIEM) solutions
to
digest and act on.
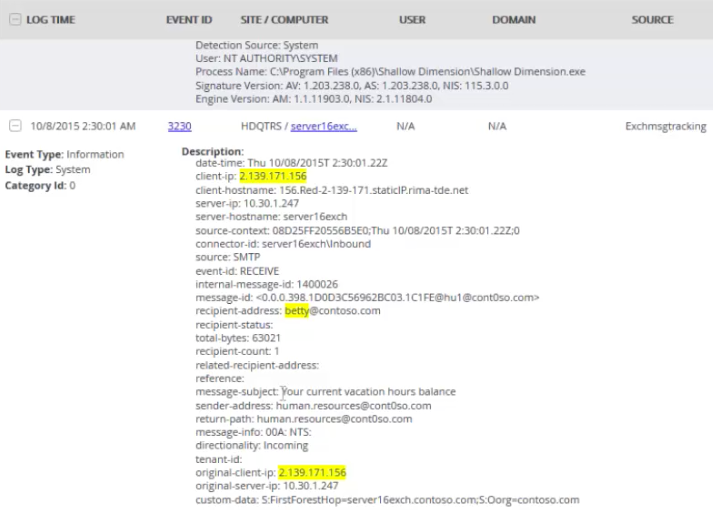
In addition, other events, such as Exchange message
tracking, provide critical details. In the example that Figure 3 shows, you can
use the originating IP address, email subject, sender and recipient addresses,
and more to identify how rogue processes might be entering the
organization.
Moreover, EventTracker automatically compares
program files against the National Software Reference Library, looks for
unsigned code and alerts you to these and other suspicious
indicators.
Indicator #2: Evidence of Persistence
An attacker doesn’t want to retain control of your
endpoints for a short period; their malicious code needs ample time to permeate
your network to give them the greatest chance of finding just the right
credentials and give them access to valuable information. Attackers need to
ensure that their code can live on so that they can resume control even after
the closing of a process, a logoff, or a reboot.
Evil Methods
This list, though not exhaustive, represents many
ways that attackers ensure their malicious code remains actively running and in
existence on the endpoint.
- Tasks.
Use of the AT command or scheduling tasks to run every minute or at logon, can
cause an endpoint to continually relaunch a malicious process.
- Tampering with
services. Replacing service path settings in the registry or
replacing a service executable can launch malicious processes at boot up. In
addition, new services are created with generic but official-looking names such
as Windows Services Update, to throw you off the scent. MSInfo is a good
starting point to identify those services that aren’t required.
- Auto-run registry
settings. The Run and RunOnce
settings found in several locations in the registry are perfect places to
nestle a reference to a malicious executable. MSInfo can play a role in
identifying what is configured to launch at bootup and logon.
- DLL tampering or
interception. The basic premise is either to modify the DLL’s import
table to reference a malicious function or to modify the DLL code itself to
detour to your code and then return it to its normal function.
- PowerShell
background jobs. A PowerShell process is spawned in the background
and runs the code necessary to keep the malicious process resident.
- Local Group
Policy. Group Policy contains a place to configure both startup
scripts and logon scripts.
- Browser add-ins
and plug-ins. Browsers have the potential for a lot of local access
to the endpoint, giving a browser the ability to re-infect a machine every time
it is opened.
Detecting Persistence
Look to the same methods that attackers use der to
find entries that are designed to guarantee persistence.
Note: Many malicious processes use more than one method to
redundantly ensure their survival. Finding references to a rogue process in any
of these locations is a indicator that it might be malicious.
Indicator #3: Suspicious traffic
Malicious code on an endpoint doesn’t exist simply
to sit there. It’s designed to replicate itself within the network and to
ultimately exfiltrate information from the network. Therefore, traffic
monitoring is another way to identify the existence of malicious
code.
You might think that you can simply use your
network monitoring sensors to pick up suspicious traffic. However, the reality
is that you need additional context only available on the endpoint, such as the
executable that is used to generate traffic, to ensure proper identification of
suspicious activity.
Evil Methods
If you find the following on your endpoints, they
could equate to suspicious network traffic:
- Use of browser
ports by non-browsers. Ports 80, 443, or 8080 should represent web
services. Attackers use these ports to update code and exfiltrate data because
the ports are always left open on your firewall. Network packets show you only
which endpoint sent traffic over which port to which IP address; they won’t
show that the traffic was a rogue DLL called by svchost.exe that was used to
send data.
- Use of browsers
over non-standard ports. Any browser not using standard ports, such
as 80, 443, or 8080, could indicate a valid process (your browsers) with a
malicious purpose.
- Unexpected
traffic. Traffic might seem normal but become suspect when you
consider either the source or the target. A few examples include web traffic to
an IP address instead of a fully qualified domain name (FQDN); Remote Desktop
Protocol (RDP), FTP (File Transfer Protocol), or Secure Shell (SSH) sessions
from abnormal endpoints; and even outbound Simple Mail Transfer Protocol (SMTP)
sessions to an external host.
Detecting Suspicious Traffic
As mentioned earlier, just using a network sensor
lacks context. You need to know not only from which endpoint traffic
originated, but also from which process. There are a few steps you can take to
investigate suspicious traffic:
- Monitor events
5154, 5155, 5156, and 5157. These events come from the Windows
Filtering Platform (WFP) and help to document the permitting and blocking of
inbound and outbound TCP or UDP connections. In each of these events, the
process ID, application path, source and destination IP
addresses, ports, and protocol are all documented, providing
you context around whether the combination of processes and ports adds up to
malicious or appropriate traffic.
- Monitor outbound
DNS requests for unusual domain names. What determines “unusual”? Use
of a reputation service might be a good fit to help provide guidelines around
appropriate domain names.
-
The overarching goal is to use the combination of traffic
patterns, the processes that generate them and the type of endpoint to
establish suspicion. Without a third-party solution, you’ll need to look
granularly at specific endpoints, searching for these mismatches of processes
and traffic patterns.
Indicator #4: Activity and User-Role
Mismatches
An attacker will use any means necessary to spread
malicious code laterally throughout the organization and exfiltrate data—even
if it means doing so in a way that doesn’t fit the normal mode of operation for
the user of the endpoint. Therefore, look for anomalies in which activity
doesn’t align with the user’s role in the organization. For example, consider
traffic for a
given type of endpoint, such as an RDP session coming from
the desktop of a user in Accounting. If their workstation has never started an
RDP session in the past but suddenly does so now, you have a potential
candidate for an infected endpoint.
Evil Methods
As suspicious traffic can be indicative of
malicious code, so can the use of tools that are rarely, if ever, used by
non-IT users:
- Utilities. Many of the tools that
IT considers foundational to configuring and supporting endpoints and networks
are all but a foreign language to regular users. This list includes (but is not
limited to) cmd.exe, rar.exe, at.exe, schtasks.exe, wmic.exe, powershell.exe,
winrm.vbs, net.exe, reg.exe, sc.exe, netstat.exe, and route.exe
- Remote
sessions. We’ve talked about RDP from a traffic standpoint, but you
should also watch for it from an activity standpoint. Normal users (except thin
client and VDI users) usually have no need to connect to a server via RDP.
- Unique mismatches
in your environment. You should devote some time to comparing the
usage difference between end-user and admin endpoints to determine which
applications (via processes) they normally run to create a profile.
Detecting Activity and User-Role
Mismatches
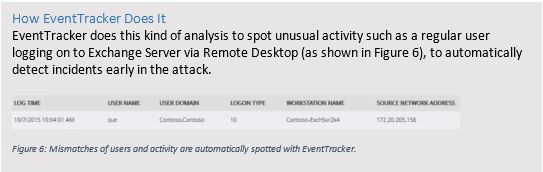
The simplest distinction to make is whether an
endpoint is normally used by a user or someone in IT. But in your organization,
the issue might be more complex than that; a user might be responsible for
initiating managed file transfers as part of their job, so an FTP session might
be in order. No matter the complexity of roles within your organization,
identifying roles and their corresponding profile of activity is the first step.
Next, identify which applications are being used. This
step is much more difficult to accomplish without at least a simple tool, such
as the old Process Monitor from Systernals with output to a CSV file.
Indicator #5: Unusual OS Artifacts
It’s very difficult for attackers not leave some
kind of trace in Windows of their presence. Knowing what to look for can help
you catchattackers at any point in the process.
The point here is to search out things not normally
found on end-user workstations. Here are a few examples:
- Scripts. If PowerShell, VB
Script, or even a command prompt was used to execute a command script, scripts
might be left over, leaving clues as to what was executed.
- RDP files. If RDP sessions have
been used, files that define connection configurations might exist.
- Shared folders on an endpoint.
Because exfiltration of data is a large part of these attacks, simple shared
folders might be used to centralize obtained files so that they can be
exfiltrated from a single machine.
- Shared folders access by an
endpoint. Looking at the previous artifact from the other
perspective, a given endpoint might have been used to connect to a central
share. A review in the registry of the following key can provide more detail on
which shares have been accessed:
KEY_CURRENT_USER\SOFTWARE\Microsoft\Windows\CurrentVersion\Explorer\MountPoints2
Shining the Spotlight on Endpoint Evil
Endpoints are here to stay for most organizations
and will continue to be a major risk area. Using the endpoint itself as a
security sensor—one that can provide information, detail, and context of
attempted breaches—can provide IT with the intelligence it requires to properly
detect and respond to attacks.
Much of the work highlighted in this paper requires
a massive amount of effort once you move past just a few endpoints. The only
way to catch attackers using these methods is to automate and EventTracker is
leading the way. EventTracker’s mature SIEM engine provides the centralized
analysis and point of management needed to handle thousands of endpoints.
Moreover, on the endpoint, EventTracker has advanced beyond the traditional
SIEM agent. EventTracker empowers your endpoints as
security sensors where you need them the most. Instead of
just forwarding event logs, EventTrackers sensor-agent watches system activity
in real-time on each and every endpoint looking for the indicators discussed in
this paper. With EventTracker you get visibility and alerting to a depth and
currency only possible with by leveraging agents on the endpoint.
ABOUT EVENTTRACKER
EventTracker offers a dynamic suite of award
winning products for SIEM and event log management. SC Magazine BestBuy
EventTracker Enterprise processes hundreds of millions of discrete log messages
to deliver vital and actionable information, enabling organizations to identify
and address security risks, improve IT security, and maintain regulatory compliance
requirements with simplified audit functionality. Security Center offers
instant security alerts and a real-time dashboard for viewing every incident in
the infrastructure,
and Compliance Center is a monitoring and early threat
detection tool.
Complementing these products is SIEM
Simplified(SM), our award winning services offering to augment IT resources in
smaller enterprises. Our experienced staff assume responsibility for all
SIEM-related tasks including daily incident reviews, daily/weekly log reviews,
configuration assessments, incident investigation support and audit
support.
Our customers span multiple sectors including
financial, communications, scientific, healthcare, banking and government, with
solutions currently deployed at over 850 global customer sites.
EventTracker was founded in 1999 and is privately
funded and held. Our corporate headquarters are located in Columbia, Maryland
in the Baltimore-Washington high tech corridor, with research and development
facilities located in both Columbia and Bangalore, India.
www.eventtracker.com
ABOUT RANDY FRANKLIN SMITH
Randy Franklin Smith is an internationally
recognized expert on the security and control of Windows and AD security. Randy
publishes
www.UltimateWindowsSecurity.com and wrote The Windows Server 2008
Security Log Revealed—the only book devoted to the Windows security log. Randy
is the creator of LOGbinder software, which makes cryptic application logs
understandable and available to log-management and SIEM solutions. As a
Certified Information Systems Auditor, Randy performs security reviews for
clients ranging from small, privately held firms to
Fortune 500 companies, national, and international
organizations. Randy is also a Microsoft Security Most Valuable
Professional.
DISCLAIMER & COPYRIGHT
Monterey Technology Group, Inc. and EventTracker
make no claim that use of this white paper will assure a successful outcome. Readers
use all information within this document at their own risk. Ultimate Windows
Security is a division of Monterey Technology Group, Inc. ©2006-2016 Monterey
Technology Group, Inc. All rights reserved.
This article by Randy Smith was originally published by EventTracker
http://www.eventtracker.com/webinars/top-5-indicators-of-evil-on-windows-hosts-endpoint-threat-detection-and-response/
Ransomware has burst onto the scene with high profile
attacks against hospitals and other organizations. How do you detect ransomware? Ransomware is just another kind of malware
and there’s nothing particularly advanced about ransomware compared to other
malware.
Ransomware uses the same methods to initially infect an
endpoint such as drive-by-downloads, phishing emails, etc. Then it generates necessary encryption keys,
communicates with command and control servers and gets down to business
encrypting every file on the compromised endpoint. Once that’s done it displays
the ransom message and waits for the user to enter an unlock code purchased
from the criminals. So at the initial stages
of attack, trying to detect ransomware is like any other end-point based
malware. You look for new EXEs and DLLs
and other executable content like scripts. For this level of detection check out my earlier webinars with
EventTracker
As criminals begin to move from consumer attacks to
targeting the enterprise, we are going to see more lateral movement between
systems as the attackers try to either encrypt enough endpoints or work their way
across the network to one or more critical servers. In either case their attacks will take a
little longer before they pull the trigger and display the ransom message
because they need to encrypt enough end-user endpoints or at least one critical
server to bring the organization to its knees. These attacks begin to look similar to a persistent data theft (aka APT)
attack.
Detecting lateral movement requires watching for unusual
connections between systems that typically don’t communicate with each other. You also want to watch for user accounts
attempting to logon to systems they normally never access. Pass-the-Hash indicators tie in closely with
later movement and that one of the things discussed in “Spotting
the Adversary with Windows Event Log Monitoring: An Analysis of NSA Guidance”.
So much of monitoring for Ransomware is covered by the
monitoring you do for any kind of malware as well as persistent data theft attacks. But what is different about Ransomware? Basically 2 things
- Detonation: The actually detonation of
ransomware (file encryption) is a very loud and bright signal. There’s no way to miss it if you are watching.
- Speed: Enterprise ransomware attacks can potentially
proceed much faster than data theft attacks.
Detonation
When ransomware begins encrypting files it’s going to
generate a massive amount of file i/o – both read and write. It has to read every file and write every
file back out in encrypted format. The
write activity may occur on the same file if directly being re-written, the
ransomware can delete the original file after writing out an encrypted
copy. In addition, if you watch which
files ransomware is opening you’ll see every file in each folder being opened one
file after another for at least read access. You will also see that read activity in bytes should be matched by write
activity.
Of course there are potential ways ransomware could cloak
this activity by either going low and slow, encrypting files over many days or
by scattering its file access between many different folders instead of
following an orderly process of all files in one folder after another. But I think it will a long time before enough
attacks are getting foiled by such detection techniques that the attackers go
to this extra effort.
How prone to false positives is this tactic? Well, what other legitimate applications have
a similar file i/o signature? I can't think of any. Backup and indexing
programs would have a nearly identical file read
signature but would lack the equal amount of write activity.
The downside to ransomware detonation monitoring is that
detection means a ransomware attack is well underway. This is late stage notification.
Speed
Ransomware attacks against an enterprise may proceed much
faster than persistent data theft attacks because data thieves have to find and
gain access to the data that is not just confidential but also re-saleable or
otherwise valuable to the attacker. That
may take months. On the other hand,
ransomware criminals just need to either:
- Lockdown at least one critical server – without
which the organization can’t function. The
server doesn’t necessarily need any confidential data nor need it be
re-saleable. On a typical network
there’s many more such critical servers than there are servers with data that’s
valuable to the bad guy for re-sale or other exploitation.
- Forget servers and just spread to as many
end-user endpoints as possible. If you
encrypt enough endpoints and render them useless you can ransom the
organization without compromising and servers at all. Endpoints are typically much easier to
compromise because of their intimate exposure and processing of untrusted
content and usage by less security savvy end-users among other reasons.
So beefing up your ransomware monitoring means doing what
you hopefully are already doing: monitoring for indicators of any type of
malware on your network and watching for signs of lateral movement between
systems. But for ransomware you can also
possibly detect late stage ransomware attacks by watching for signature file
i/o by unusual processes. So you need to
be fast in responding.
And that’s the other way that ransomware differentiates
itself from data theft attacks: the need for speed. Ransomware attacks can potentially reach
detonation much faster than data thieves can find, gain access and exfiltrate
data worth stealing. So, while the
indicators of compromise might be the same for most of all ransomware or
persistent data theft attack, reducing your time-to-response is even more
important with ransomware.
“This article by Randy Smith was originally published by EventTracker”
http://www.eventtracker.com/newsletters/detecting-ransomware/