Just released: Randy Franklin Smith whitepaper
Fri, 19 May 2017 11:42:23 GMT
 email this
•
email this
•
 digg
•
digg
•
 reddit
•
reddit
•
 dzone
dzone
comments (0)
•
references (0)
Related:
5 Indicators of Endpoint Evil
Auditing Privileged Operations and Mailbox Access in Office 365 Exchange Online
Severing the Horizontal Kill Chain: The Role of Micro-Segmentation in Your Virtualization Infrastructure
Anatomy of a Hack Disrupted: How one of SIEM’s out-of-the-box rules caught an intrusion and beyond
Work Smarter – Not Harder: Internal Honeynets Allow You to Detect Bad Guys Instead of Just Chasing False Positives
Tue, 07 Mar 2017 10:44:31 GMT
Log collection, SIEM and security monitoring are the journey
not the destination. Unfortunately, the
destination is usually a false positive. This is because we’ve gotten very good at collecting logs and other
information from production systems, filtering that data and presenting it on a
dashboard. But we haven’t gotten that
good at distinguishing events triggered by bad guys from those triggered by
normal every day activity.
A honeynet changes that completely.
At the risk of perpetuating a bad analogy I’m going to refer
to the signal to noise ratio often thrown around when you talk about security
monitoring. If you like that
noise/signal concept then the difference is like putting an egg timer in the
middle of time square at rush hour. Trying to hear it is like trying to pickout bad guy activity in logs
collected from production systems. Now
put that egg timer in a quiet room.
That’s the sound of a bad guy hitting an internal honeynet.
Honeynets on your internal network are normally very
quiet. The only legitimate stuff that’s
going to hit them are things like vulnerability scanners, network mapping tools
and… what else? What else on your
network routinely goes out and touches IP addresses that it’s not specifically
configured to communicate with?
So you either configure those few scanners to skip your
honeynet IP ranges or else you leverage them for as positive confirmation that
your honeynet is working and reporting when it’s touched. You just de-prioritize that expected traffic
to an “honorable mention” pane on your dashboard.
On the other hand, (unless someone foolishly publishes it)
the bad guy isn’t going to know the existence of your honeynet or its
coordinates. So as he routinely scans
your network he’s inevitably going to trip over your honeynet. If you’ve done it right. But let’s talk about some of these points.
First, how would a bad guy find out about your honeynet?
- Once he gets control of IT admin users accounts
and reads their email, has access to your network and security documentation,
etc. But if you have good privileged
access controls this should be fairly late stage. Honeynets are intended to catch intrusions at
early to mid-stage.
- By lurking on support forums and searching the
Internet (e.g. Stackoverflow, honeynet vendor support sites). It goes without saying, don’t reveal your
name, company or company email address in your postings.
- By scanning your network. It’s pretty easy to identity honey nets when
you come across them – especially low-interaction honeynets which are most
common. But guess what? Who cares? They’ve already set off the alarm. So this one doesn’t count.
So, honeynets are definitely a matter of security through
obscurity. But you know what? We rely on security through obscurity a lot
more than we think. Encryption keys are
fundamentally security through obscurity. Just really, really, really, good obscurity. And security through obscurity is only a
problem when you are relying on it as a preventive control – like using
a “secret” port number instead of requiring an authenticated connection. Honeynets are detective controls.
But what if you are up against not just a persistent threat
actor but a patient, professional and cautious one who assumes you have a
honeynet and you’re listening to it. He’s going to tiptoe around much more carefully. If I were him I would only touch systems out
there that I had reason to believe were legitimate production servers. Where would I collect such information? Places like DNS, browser history, netstat output,
links on intranet pages and so on.
At this time, most attackers aren’t bothering to do
that. It really slows them down and they
know it just isn’t necessary in most environments. But this is a constant arms race so it good
to think about the future. First, a bad
guy who assumes you have a honeynet is a good thing because of what I just
mentioned. It slows them down. Giving more time for your other layers of
defense to do their job.
But are there ways you to optimize your honeynet
implementation for catching the honeynet-conscious, patient attacker? One thing you can do is go to the extra
effort and coordination with your network team to reserve more and smaller
sub-ranges of IP addresses for your honeynet so that its widely and granularly
dispersed throughout address space. This
makes it harder to make a move without hitting your honey net and further
reduces the assumptions that attackers usually find it safe to make such as
that all your servers are in range for static addresses, workstations in
another discreet range for DHCP and then another big block devoted to your
honeynet.
The bottom line though is Honeynets are awesome. You get very high detection with
comparatively small investment. Checkout
my recent webinar on Honeynets sponsored by EventTracker who now offers a
Honeynet-as-a-Service that is fully integrated with your SIEM. Deploying a honeynet and keeping it running
is one thing, but integrating it with your SIEM is another. EventTracker nails both.
“This article by Randy Smith was originally published by EventTracker” https://www.eventtracker.com/newsletters/internal-honeynet/
email this
•
digg
•
reddit
•
dzone
comments (0)
•
references (0)
Related:
Auditing Privileged Operations and Mailbox Access in Office 365 Exchange Online
Severing the Horizontal Kill Chain: The Role of Micro-Segmentation in Your Virtualization Infrastructure
5 Indicators of Endpoint Evil
Live with Dell at RSA 2015
Tracking removable storage with the Windows Security Log
Mon, 02 Jan 2017 10:46:36 GMT
With data breaches and Snowden-like information grabs I’m
getting increased requests for how to track data moving to and from removable
storage such as flash drives. The good
news is that the Windows Security Log does offer a way to audit removable
storage access. I’ll show you how it
works and since the sponsor for this post, EventTracker, has some enhanced
capabilities in this area I’ll briefly compare native auditing to
EventTracker.
Removable storage auditing in Windows works similar to and
logs the exact same events as File System auditing. The difference is in controlling what
activity is audited.
To review, with File System auditing, there are 2-levels of
audit policy. First you enable the Audit
File System audit subcategory at the computer level. Then you choose which folders you wish to
audit and enable object level auditing on those folders for the users/groups,
permissions and success/failure results that need to be monitored. For instance you can audit Read access on
C:\documents for the SalesReps group.
However Removable Storage auditing is much simpler to enable
and far less flexible. After enabling
the Removable Storage audit subcategory (see below) Windows begins auditing all
access requests for all removable storage. It’s equivalent to enabling auditing Full Control for Everyone.
As you can see auditing removable storage is an all or
nothing proposition. Once enabled,
Windows logs the same event ID 4663 as for File System auditing. For example the event below shows that user rsmith
wrote a file called checkoutrece.pdf to a removable storage device Windows
arbitrarily named \Device\HarddiskVolume4 with the program named Explorer (the
Windows desktop).
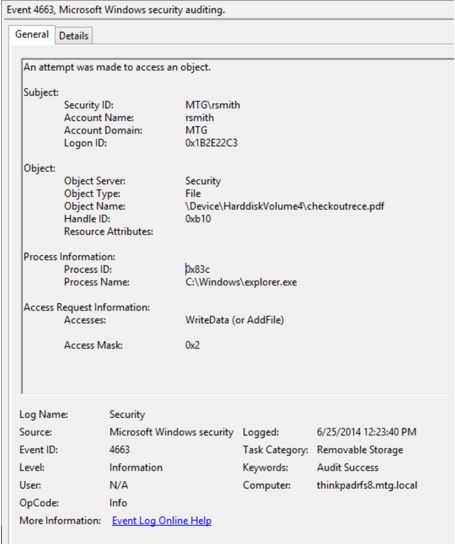
How do we know this is a removable storage event and not
just normal File System auditing? After
all it’s the same event ID as used for normal file system auditing. Notice the Task Category above which says
Removable Storage. The information under
Subject tells you who performed the action. Object Name gives you the name of the file, relative path on the
removable storage device and the arbitrary name Windows assigned the device the
first time it was connected to this system. Process information indicates the program used to perform the
access. To understand what type of access
(e.g. Delete, Write, Read) was performed look at the Accesses field which lists
the permissions actually used.
If you wish to track information being copied from your
network to removable storage devices you should enable Audit Removable Storage
via group policy on all your endpoints. Then monitor for Event ID 4663 where Task Category is Removable Storage
and Accesses is wither WriteData or AppendData.
As you can see Microsoft took the most expedient route
possible to providing an audit trail of removable storage access. There are events for tracking the connection of devices – only the file
level access events of the files on the device. These events also do not provide the ability to see the device model,
manufacturer or serial number. That
device information is known to Windows – it just isn’t logged by these events
since they captured at the same point in the operating system that other file
access events are logged. On the other
hand, EventTracker’s agent logs both connection events and information about
each device. In fact EventTracker event
allows you selectively block or allow access to specific devices based on
policy you specify. I encourage you to
check out EventTracker’s
enhanced abilities.
This article by Randy Smith was originally published by EventTracker”
https://www.eventtracker.com/newsletters/tracking-removable-storage-windows-security-log/
email this
•
digg
•
reddit
•
dzone
comments (0)
•
references (0)
Related:
Auditing Privileged Operations and Mailbox Access in Office 365 Exchange Online
Understanding the Difference between “Account Logon” and “Logon/Logoff” Events in the Windows Security Log
5 Indicators of Endpoint Evil
Severing the Horizontal Kill Chain: The Role of Micro-Segmentation in Your Virtualization Infrastructure
Auditing Privileged Operations and Mailbox Access in Office 365 Exchange Online
Tue, 27 Dec 2016 10:16:02 GMT
Email remains one of the most heavily used communications
mediums within organizations today. With as much as 75 percent of your
organization’s intellectual property stored in email[1], Microsoft
Exchange is for all practical purposes a treasure trove of organization’s most
valuable secrets—just waiting for inappropriate access.
Regulatory bodies realize this and therefore email and
compliance go hand in hand-in-hand. So
IT needs to keep a watchful eye on exactly who is accessing what within Exchange
Online. And that focus shouldn’t be only on the people you trust, such as those
who have been granted access to a given mailbox, but on any user. IT needs to help ensure visibility into the actions of
potential threat actors who might have hijacked privileged accounts. The first
thing external threat actors do after infiltrating your network is attempt to
identify accounts that have elevated permissions. And those accounts can have
access to the sensitive information stored within Exchange Online.
For years, Microsoft has enabled an audit trail within
on-premises Exchange Server. The same capability exists for Exchange Online—with
some improvements to boot—giving IT organizations visibility into actions
performed by administrators and regular users alike. But be forewarned: You’re
largely on your own here. Microsoft has provided some functionality via
administrative consoles, but the ability to successfully enable, configure, and
audit Exchange Online events depends fairly heavily on PowerShell[LP1].
The challenge isn’t configuring the auditing of events; that
part is simple. Rather, the challenge is finding the event or events that are pertinent
to the auditing query in question. If you’ve spent any time in Event Viewer,
you know how it feels to rummage through countless thousands of event entries,
trying to find the one entry you’re looking for.
Microsoft has taken great strides to provide you the tools
necessary to simplify the process of auditing. Still, a bit of work remains to
enable, configure, and retrieve meaningful audit data.
This whitepaper explains those necessary steps and provides
guidance for properly auditing changes to your Exchange Online environment
within Office 365. The paper also covers ways to focus your auditing lens on
the right what, who, and where so that
you can quickly and accurately find answers to those sometimes difficult
auditing questions.
Auditing
Experts – Quest
Understanding what’s going on within
Exchange Online involves much more than the ability to centralize audit data.
To truly audit such complex environments, you need a deeper understanding of each
event and its detail, how audit events correlate, and what that information means
to the organization—along with the ability to make the data understood.
Quest Change Auditor is the culmination
of tens of thousands of hours of work dissecting every auditable event over a
variety of platforms and applications. This effort turns raw, indecipherable
information into intelligent detail, from which an IT organization can obtain
actionable insight.
Look for auditing insights from Quest
throughout this paper.
Connecting to Office 365 to Enable and Configure Auditing
The first step is to enable auditing. Auditing is disabled
by default, as not every organization is required to — or even interested in — auditing
what happens within Exchange Online. As previously mentioned, much of this step
happens in PowerShell. You’ll need to connect to Exchange Online via PowerShell
so that all commands are run against your instance of Exchange Online.
Open a PowerShell window. You don’t need to be a local admin
to run Exchange commands against the cloud, but you do need appropriate
permissions within Exchange Online; more on these permissions
soon.
To connect to Exchange Online, you’ll run four commands.
Set-ExecutionPolicy RemoteSigned
This command tells PowerShell that any scripts that are downloaded
by a trusted publisher (Microsoft, in this case) can run on the local computer.
$UserCredential = Get-Credential
This command displays a login dialog box that you use to
store an Office 365 admin credential (which does not necessarily need to be the
same credential you used to start the PowerShell window) as a parameter for use
in the third command.
$Session = New-PSSession –ConfigurationName
Microsoft.Exchange –ConnectionUri https://outlook.office365.com/powershell-liveid/ -Credential $UserCredential –Authentication Basic –AllowRedirection
This command establishes a new PowerShell session with Office
365, using the provided credentials and the specified URL. The command stores all
this information in the $Session
variable.
Import-PSSession $Session
This command imports commands
(e.g., cmdlets, functions, aliases) from the remote computer (i.e., Office 365)
into the current session. At this point, you’re properly connected to Exchange Online and can begin auditing
your Exchange Online environment.
Quest
Insight – What Should You Be Auditing?
Exchange Online can be configured to
generate a ton of information—which, of course, means more data for you to sift
through. Because you are essentially in control of how much audit data is generated,
you can determine which activities to include. You can focus on three categories
of audit activity:
·
Message tracking
is the actual flow of messages from one user to another. At a minimum, this
category can be used to show who is emailing whom, such as whether email is
being sent to a competitor. On a larger scale, message tracking can be used
with analytics to see how the business uses email. This tracking is useful to
see how internal messaging flows; for example, from one department to another. Message
tracking can also be used to see the flow of traffic in and out of the
organization; for example, which domains send or receive the most email. You
can use the Get-MessageTrace cmdlet
to retrieve a list of messages that meet query criteria such as sender or
recipient address, date range, or source IP address. This activity is most
appropriate when a review of specific sent and received messages is needed in
addition to a review of mailbox contents. This tracking can also be useful when
connected to a SIEM solution, using keyword alerts to identify inappropriate
messages.
·
Admin operations
involve any actions that are taken within Office 365, including actions by your
IT team or Microsoft (which maintains the Exchange Online instance). Admin
operations, such as assigning permissions to a mailbox or setting up forwarding
rules, can play a key role during an audit; even IT can play a role in
inappropriate behaviors.
·
Non-owner
mailbox access occurs whenever someone other than the owner accesses a
mailbox. This category is important when sensitive information has been
inappropriately accessed or forwarded, and the focus is on identifying who is
responsible.
Because message tracking typically falls outside an IT
security audit, this paper foregoes that topic and focuses on the other two audit
areas, which directly affect your organization’s ability to document access,
changes, and actions that would be of interest during an audit.
Auditing Admin Operations
Auditors are big believers in the ability to watch the
watchers. Questions around changes that IT has made are just as important as those
that focus on users exercising access that IT has granted. For example, if an
audit revolves around the CEO forwarding intellectual property to a competitor,
a good auditor doesn’t just accept that the CEO forwarded the information.
Rather, the auditor also asks who has been granted permissions to the CEO’s
mailbox—and who in IT granted those permissions.
Both security and compliance initiatives are useless without
auditing admin operations. Because there are no preventative controls for
admins (who need the ability to do “everything” to get their job done), the
need for controls that detect and deter inappropriate behavior is necessary. By
putting an audit trail in place, you create accountability. After all, knowing that
they’re being audited tends to encourage admins to keep their behavior in
check.
When it comes to Exchange Online, a number of actions can
indicate malicious activity. For example, the exporting of a mailbox doesn’t
require logging on to the mailbox; IT can simply export and review the local
PST. Therefore, IT logging on to an exported mailbox should trigger non-owner
mailbox auditing. Another example is granting permissions: IT could assign a
cohort inappropriate permissions to another user’s mailbox, and then remove those
permissions after improper access is completed. Unless you have non-owner
mailbox auditing enabled, this access would go completely unnoticed.
You can see why admin operations need to be included as part
of your auditing strategy. Everything an admin does within Exchange Online is
ultimately a PowerShell command, so Exchange audits admin activity at the PowerShell
level. Each time an audited cmdlet is run, the action is logged.
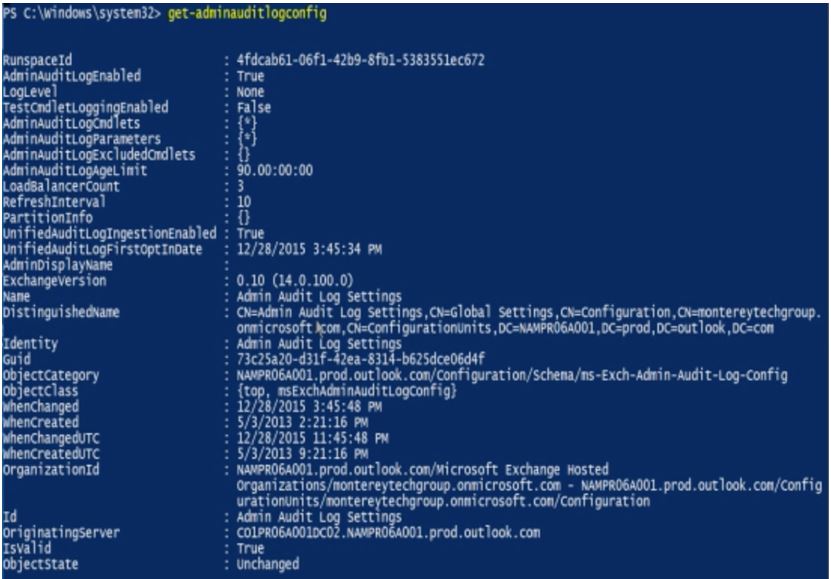
To check which auditing is enabled within your organization,
you can use the Get-AdminAuditConfig
command, shown in the following figure.
Place specific focus on the AdminAuditLogCmdlets, AdminAuditLogExcludedCmdlets, and AdminAuditLogParameters fields, which
identify whether every admin operation is audited or a subset.
Quest Insight – Age Limits
By default,
admin audit data is kept for 90 days (as indicated by the AdminAuditLogAgeLimit value in the previous figure). You might want
to consider extending the retention time. Organizations that perform annual
audits should consider extending this value to more than 365 days (one year).
To enable auditing, you need
to leverage the Set-AdminAuditLogConfig
cmdlet:
Set-AdminAuditLogConfig
–AdminAuditLogEnabled $true
Quest
Insight – Enabling Just the Right Amount of Admin Auditing
Each organization has different auditing
requirements, so auditing of admin actions isn’t always as simple as “just
audit everything.” If you simply enable all
admin auditing, you’ll see all the changes that Microsoft makes on the back end,
which might be something you don’t care to filter through during an audit.
Because admin auditing is based on the
premise that every performed action relates to running a PowerShell cmdlet, the
Set-AdminAuditLogConfig cmdlet enables
you to specify which cmdlets and cmdlet parameters to include or exclude. Be
sure to note that auditing of commands in Exchange Online does not include
read-only types of commands, such as any Get
and Search commands.
You can specify individual cmdlets or use
wildcard characters to denote a group of cmdlets:
Set-AdminAuditLogConfig –AdminAuditLogEnabled $true
-AdminAuditLogCmdlets * -AdminAuditLogParameters *
-AdminAuditLogExcludedCmdlets *Mailbox*, *TransportRule*
So, how do you get
this information out of Office 365?
There are two ways to extract admin auditing information from
Office 365: via PowerShell or by using the Office 365 Security & Compliance
portal.
Auditing via PowerShell
Using PowerShell to audit can be accomplished by using the Search-AdminAuditLog cmdlet. When you use this cmdlet with no filtering
parameters, you obtain the last 1000 entries. This information shows the
cmdlets and parameters that were used, who ran each action, whether the action was successful, the object affected, and more, as shown in
the following figure.
The Search-AdminAuditLog
cmdlet results don’t provide comprehensive detail; for example, the Caller field, which specifies which
users called the cmdlet, is blank. So the cmdlet is more useful if you’re
trying to get an overview of changes made rather than performing an actual
audit.
You can alternatively use the New-AdminAuditLogSearch cmdlet to receive an emailed XML report of
the log entries within a specified date. For example, in the following figure,
you can see that an admin is adding full mailbox permissions to the user bbrooks.
Quest
Insight – Filtering Cmdlet Searches
The basic cmdlets return a large amount
of data that might include the behind-the-scenes management actions performed
by Microsoft. So it’s important to use the cmdlet’s parameters to filter the
noise of all the resulting data.
Both the Search-AdminAuditLog and New-AdminAuditLogSearch
cmdlets enable you to filter by date, cmdlet used, parameters used, the user
who performed the action, whether that user is external to the organization,
and the objects that the action affected.
By using some of these filters, you can hone
down the results to a more pertinent set of data, increasing your productivity
by more quickly finding the answers you need.
Auditing via the Office 365 Security & Compliance Portal
Those who simply aren’t “PowerShell people” and would rather
use a management console can take advantage of the Audit Log Search
functionality in the Office 365 Security & Compliance Portal. In the
pre-created Activities, you can begin
your audit by simply selecting a management action, such as the delegation of
mailbox permissions in the following figure. You can use the additional filter
fields to further refine the results to the few that meet your criteria.
Be aware that the Activities
are a double-edged sword.
You are limited to those activities (with the supported filters) and cannot
generate custom search scenarios of your own. For example, you can’t search for
every time someone exported a mailbox (at the time of this writing).
Results can be exported as well, for reporting and further analysis.
You will experience a few limitations should you choose to use
the console. First, you’re limited to only 90 days of audit data — and there’s no
way around that. In addition, although audit data is available to PowerShell
cmdlets within 30 minutes, accessing the same data via the console can take up
to 24 hours.
Auditing Non-Owner-Mailboxes
Auditing administrative actions helps to identify the events
leading up to inappropriate activity within Exchange. But the real value is
found in auditing access to the data that is stored within Exchange. The
assumption with non-owner mailbox auditing is that the mailbox owner is using
the mailbox appropriately. (Sure, cases of insider misuse by a mailbox owner
exist, but those issues are addressed by message tracking.) So, the focus
shifts to any non-owners that access a given mailbox.
In general, you should be concerned any time a non-owner
views, sends email on behalf of, or deletes email in another user’s mailbox.
Delegates — a part of Exchange for as long as the product has been available — are
a vital part of the productivity of many users who require assistance from
other employees. But because delegate access exists, and because inappropriate
delegate access can be granted, auditing non-owner access to mailboxes provides
an important piece of data.
Quest
Insight – Which Mailboxes Should You Audit?
Which mailboxes to audit is a valid
question. Find the answer by considering these questions:
·
Is there
any delegate access? If so, turn on auditing. This way, you have an audit
trail of every time the delegate accesses the owner’s mailbox and what was
done.
·
Does the
mailbox contain sensitive data? Mailboxes that are owned by users who regularly
send and receive financials, intellectual property, legal documents, and so on might
be prime targets for insider activity. Even when no delegates are assigned to a
mailbox that contains sensitive data, enable auditing proactively so that you
have an audit trail of any and all access to the mailbox.
Unlike admin auditing, which is an organizational-wide audit
setting, non-owner mailbox auditing is enabled on a per-mailbox basis. Audit
log entries are retained, by default, for 90 days—a value that can be
customized.
You can enable non-owner mailbox auditing at three levels,
each with specific audited actions:
- Admin.
This level audits actions by admins who have not been granted delegate
permissions to a mailbox.
- Delegate.
Anyone who is assigned permissions or given Send
on Behalf of permissions is considered a delegate.
- Owner. Auditing for the mailbox owner is typically
disabled, as it isn’t relevant to audits. In addition, enabling owner auditing generates
a great deal of information. Non-owner access is generally infrequent and
limited in scope (e.g., an assistant sending out calendar invites for their
boss, someone in IT finding a specific message), whereas audits of owner access
encompass every email created, read, filed, deleted, and so on.
|
Action
|
Admin
|
Delegate
|
Owner
|
|
Copy
|
ü
|
|
|
|
Create
|
ü
|
ü
|
ü
|
|
FolderBind
|
ü
|
ü
|
|
|
HardDelete
|
ü
|
ü
|
ü
|
|
MailboxLogin
|
|
|
ü
|
|
MessageBind
|
ü
|
|
|
|
Move
|
ü
|
ü
|
ü
|
|
MoveToDeletedItems
|
ü
|
ü
|
ü
|
|
SendAs
|
ü
|
ü
|
|
|
SendOnBehalf
|
ü
|
ü
|
|
|
SoftDelete
|
ü
|
ü
|
ü
|
|
Update
|
ü
|
ü
|
ü
|
Enabling Non-Owner Mailbox Auditing
Like admin auditing, non-owner mailbox auditing is enabled by
using PowerShell via the Set-Mailbox
cmdlet. As previously mentioned, this action is accomplished on a per-mailbox
basis and requires that you specify which level or levels of auditing (admin,
delegate, or owner) you want to enable:
Set-Mailbox –Identity “John Smith” –AuditDelegate SendOnBehalf,FolderBind
–AuditEnabled $true
AuditDelegate
in this command. This parameter enables
mailbox auditing, but only for delegate access and only for the specified actions.
You either need to perform this command a second time to configure auditing of Administrator
access, specifying which actions should be audited (as shown in the following
command), or include the AuditAdmin
parameters in the same execution of this cmdlet:
Set-Mailbox –Identity “John Smith” –AuditAdmin
Copy,MessageBind
-AuditEnabled $true
Organizations that audit the mailbox access of every user must enable mailbox auditing
for new users. This approach might require a bit more PowerShell scripting, to
continuously perform a search for a user account with a recent create date and to
run the previous commands against that account.
Quest
Insight – Which Actions Should You Audit?
You should enable both admin and delegate access to help ensure that any
(and every) instance of non-owner access is recorded. Auditing of most of the previously
mentioned admin actions is automatic whenever auditing is enabled for a given
mailbox, with the exception of MessageBind
(which for all intents and purposes can be considered a reading of a message)
and Copy. Auditing of these actions needs
to be enabled separately (as explained earlier). Also note that whenever an
admin is assigned Full Access to a
mailbox, that admin is considered a delegate user and is audited as such.
Like admin, some delegate actions (i.e., Create, HardDelete, SendAs, SoftDelete, and
Update) are also automatically
audited. Therefore, you need to enable auditing for any other actions that you want
to log.
Some organizations use solutions that
scan mailboxes for compliance, identification of sensitive data, categorization
for legal purposes, and so on. Such solutions might trigger bogus events
because of their access of a given mailbox. In such situation, you can use the Set-MailboxAuditBypassAssociation cmdlet
to bypass auditing for a specific, trusted account.
Now that you have enabled
mailbox auditing, how do you get your audit logs out?
This process is a bit complicated, as it depends on how many
mailboxes you need to audit, how much detail you want to obtain, and whether
you need the raw audit data or a report format. You have a few options:
- Synchronously
via PowerShell. You can use the Search-MailboxAuditLog
cmdlet to search a single mailbox’s audit log entries. The cmdlet displays
search results in the Exchange Management Shell window and provides limited
detail that might not meet your auditing requirements.
Asynchronously
via PowerShell. You can use the New-MailboxAuditLogSearch
cmdlet to search through the audit logs of one or more mailboxes, with the results sent to a specified
email address as an XML file. If you want to pull audit data into your SIEM
solution, use this option. Should your cmdlet query criteria generate too many
results, then the received email simply informs you that the query was a
failure. You’ll need to further hone the results to a smaller data set,
potentially requiring the combination of multiple XML files to represent a
complete audit of all actions. Be aware that Exchange 2016 allows only 10
searches of this type per mailbox within a 24-hour period.Exchange
admin center reports. From within the Exchange admin center’s reports
section (not the Office 365 Security
& Compliance portal), you can run a Search
for mailboxes accessed by non-owners report. However, you cannot export
this data.- Office
365 Management Activity API. Microsoft provides a RESTful API to access
audit data. This API requires some significant development, so it might not be an option for most organizations. However this is the only viable option
for getting your all your audit data out of the cloud and into a
compliance-ready secure archival and monitoring platform. To be compliant you have to use this API.
It can take up to 24 hours for events to show up in the unified
audit log where they are stored, so you should expect some latency around audit
requests. Also note that none of these options make it truly easy to obtain the
information you need. Some don’t provide the necessary granularity, whereas others
require that granularity if they are to be valuable. Think of each option more
as another tool to access raw data than as an auditing solution designed to
provide you with correlated, formatted intelligence around performed actions.
Meeting Compliance and Security Requirements
The good news is that Office 365 does capture the audit
data you need. But compliance and security require more than just capture audit
data. You have to protect, archive and
most importantly monitor that audit data. And monitoring means correlating with other security information from
your environment so that you can actually detect attacks and misuse.
So the bad news is that if there is no way you can meet
enterprise compliance and security requirements with the out of box
functionality of Office 365. You must
either write your own application to access the Management Activity API or
exploit a solution that does that for you.
Enter Quest Change Auditor. Change Auditor now integrates audit logs from Exchange Online with the
rest of the activity Change Auditor collects, normalizes and monitors from all
over your network. The latest version of
Change Auditor implements the Management Activity API and other APIs from
Office 365 to automatically collect Exchange Online mailbox and administrator
audit logs. Change Auditor brings to
Exchange Online the same Who, What, When and Where capability ChangeAuditor is
famous for. And the cool thing is now
you see what a given user like Bob is doing both in the cloud and on your internal
network because ChangeAuditor already monitors
- Active Directory
- SharePoint
- Windows
- SQL Server
- Network Attached Storage
- Lync
- VMware
You can’t be compliance without monitoring your environment
and that fact doesn’t go away when you move to the cloud. Office 365 captures the activity required by
enterprises for compliance but it’s up to you after that. Change Auditor solves this issue and puts
cloud activity and on-prem events on the same pane of glass.
About Randy Franklin
Smith
Randy Franklin Smith is an internationally recognized expert
on the security and control of Windows and AD security. Randy publishes www.UltimateWindowsSecurity.com
and wrote The Windows Server 2008 Security Log Revealed—the only book devoted
to the Windows security log. Randy is the creator of LOGbinder software, which
makes cryptic application logs understandable and available to log-management
and SIEM solutions. As a Certified Information Systems Auditor, Randy performs
security reviews for clients ranging from small, privately held firms to
Fortune 500 companies, national, and international organizations. Randy is also
a Microsoft Security Most Valuable Professional.
Disclaimer
Monterey Technology Group, Inc. and Dell Software make no
claim that use of this white paper will assure a successful outcome. Readers
use all information within this document at their own risk.
email this
•
digg
•
reddit
•
dzone
comments (0)
•
references (0)
Related:
Auditing Privileged Operations and Mailbox Access in Office 365 Exchange Online
5 Indicators of Endpoint Evil
Severing the Horizontal Kill Chain: The Role of Micro-Segmentation in Your Virtualization Infrastructure
Anatomy of a Hack Disrupted: How one of SIEM’s out-of-the-box rules caught an intrusion and beyond
Tracking Physical Presence with the Windows Security Log
Tue, 20 Dec 2016 10:52:13 GMT
How do you figure out when someone was actually logged onto their
PC? By “logged onto” I mean, physically
present and interacting with their computer. The data is there in the
security log but it’s so much harder than you’d think.
First of all, while I said it’s in the security log, I didn’t say
which one. The bad news it isn’t in the domain controller log. Domain controllers know when you logon but they don’t know when you logoff.
This is because domain controllers just handle initial authentication to the
domain and subsequent authentications to each computer on the network. These are reflected as Kerberos events for Ticket-Granting Tickets and Service
Tickets respectively. But domain controllers are not contacted and have
no knowledge when you logoff – at all. In fact, look at the evens under Account Logon audit policy subcategory;
these are the key domain controller events generated when a user logs on with a
domain account. As you can see there is
no logoff event. That event it only
logged by the Logoff subcategory which and really, the whole concept of a discreet session with a logon
and logoff has disappeared. You may
remain “logged on” to your PC for days if not weeks. So the real question is not “Was Bob logged
in?”, it’s more about “Was Bob physically present, interacting with the
PC?”. To answer this you have to look at
much more than simple logon/logoff events which may be separated by long
periods of time during which Bob is anywhere but at his computer.
Physical presence auditing requires looking at all the events
between logon and logoff such as when the console locks, the computer sleeps
and screen saver events.
Logon session auditing isn’t just a curious technical challenge. At every tradeshow and conference I go to, people come to me with various
security and compliance requirements where they need this capability. In
fact one of the cases where I’ve been consulted as an expert witness centered
around the interpretation of logon events for session auditing.
The absolute only way to track actual logon sessions is
to go to the workstation’s security log. There you need to enable 3 audit
subcategories:
- Logon
- Logoff
- Other
Logon/Logoff
Together, these 3 categories log 9 different events relevant to
our topic
- 4624 - An account was successfully
logged on
- 4634 - An account was logged off
- 4647 - User initiated logoff
- 4800 - The workstation was locked
- 4801 - The workstation was
unlocked
- 4802 - The screen saver was
invoked
- 4803 - The screen saver was
dismissed
But how do you correlate these events because that’s what it’s all
about when it comes to figuring out logon sessions. It is by no means a
cakewalk. Matching these events is like sequencing DNA but the
information is there. The best thing to
do is experiment for yourself. Enable
the 3 audit policies above and then logon, wait for your screen saver to kick
in, dismiss the screen saver, lock the console as though you are walking away
and then unlock it. Allow the computer
to sleep. Wake it back up.
As you can see there is some overlap among the above events. What you have to do is between a given
logon/logoff event pair (linked by Logon ID), identity the time periods within
that session where the user was not present as a result of
- Sleep (that of the computer)
- Hibernation
- Screen saver
- Console locked
And count any session as ending if you see
- Event ID 4647 for that session’s
Logon ID (User initiated logoff)
- Event ID 4354 for that session’s
Logon ID (Logoff)
- Event ID 4608 – System startup
As you can see, the information is there. But you have to collect it and that is a
challenge for most organization because of the sheer number of
workstations. SIEM solutions like
EventTracker automate this for you whether by remote event collection which can
be practical in some cases or with the more feasible end-point agent.
“This article by Randy Smith was originally published by EventTracker” https://www.eventtracker.com/newsletters/tracking-physical-presence-windows-security-log/
email this
•
digg
•
reddit
•
dzone
comments (0)
•
references (0)
Related:
Auditing Privileged Operations and Mailbox Access in Office 365 Exchange Online
Understanding the Difference between “Account Logon” and “Logon/Logoff” Events in the Windows Security Log
5 Indicators of Endpoint Evil
Severing the Horizontal Kill Chain: The Role of Micro-Segmentation in Your Virtualization Infrastructure
How to Audit Privileged Operations and Mailbox Access in Office 365 Exchange Online
Fri, 02 Dec 2016 12:40:20 GMT
Moving Exchange to the Office 365 cloud eliminates a lot of
work but it doesn’t eliminate your compliance responsibilities or security
requirements. To be compliant and to
detect information grabs and data theft you need 2 critical feeds of activity
from Exchange Online:
- Non-owner mailbox access – especially “high
value” mailboxes like executives
- Privileged user operations
Exchange Online provides the ability to monitor both. And if you are familiar with Exchange
on-premise you will find a degree of shared functionality – at least on the
surface.
For instance, the configuration of mailbox audit policy and
of the admin audit log use the same 2 PowerShell commands as Exchange
on-premise
- Set-Mailbox and all the “-Audit…” parameters
- Set-AdminAuditLogConfig
But as with Exchange on-premise, getting the audit data out of Exchange Online is nowhere as
easy. Especially with regard to mailbox
auditing. The Search-MailboxAuditLog
command that runs synchronously has restrictions on the amount of detail that
eliminates it from consideration. The
asynchronous New-MailboxAuditLogSearch command has restrictions (also found in
Exchange 2016) that silently limits you to 10 search requests in any 12-hour
period. And those search requests have
caps on the amount of results and can take many hours to be fulfilled.
On the interactive side, Office 365 provides an Audit and
Compliance portal that allows you to perform ad hoc searches against the “unified
audit log” which includes Exchange Online audit events. However this portal is really only
appropriate for fairly casual investigations into recent activity. You are limited to certain pre-conceived
search scenarios of which viewing content of mailboxes is conspicuously
absent. Perhaps most importantly, Office
365 only keeps audit data for 90 days.
So how does an enterprise fulfill their compliance
requirements? Microsoft is certainly not
unaware of compliance and the fact that they can’t go to market without giving
customers some options. Right now there
is just one option: the Management Activity API. This RESTful service does provide an
enterprise-grade ability to get all your audit data out of Office 365. But it requires custom programming and at
that point you’ve only gotten the audit data out of the cloud in XML
format. What do you do with it
then? Never mind the rest of the
compliance story such as reporting, alerting, archiving and so on. And if I was a cyber security officer I’d
want to be able to correlate that activity in the cloud with everything else
going on in my network.
That’s where Quest Change Auditor comes in. The folks at Quest have done the heavy
lifting to integrate audit logs from Exchange Online with the rest of the activity
they collect, normalize and monitor from all over your network. The latest version of Change Auditor
implements the Management Activity API and other APIs from Office 365 to
automatically collect Exchange Online mailbox and administrator audit logs. Change Auditor brings to Exchange Online the
same Who, What, When, Where,
and what Workstation capability ChangeAuditor is famous for. And the cool thing is now you see what a
given user like Bob is doing both in the cloud and on your internal network
because ChangeAuditor already monitors
- Active Directory
- Azure AD
- Windows
- SharePoint
- SQL Server
- Network Attached Storage - EMC, NetApp, Dell FluidFS
- Skype for Business/Lync
- VMware
You can’t be secure
and compliant without monitoring your environment and that fact doesn’t go away
when you move to the cloud. Office 365
captures the activity required by enterprises for compliance but it’s up to you
after that. Change Auditor simplifies the audit process by tracking, auditing,
reporting and alerting on Microsoft® Exchange Server and Office 365 Exchange
Online configuration and permission changes in real time, and solves
this issue by combining cloud activity and on-premise activity on the same pane of
glass. To ensure Exchange and Office 365
compliance, you can automatically generate intelligent, in-depth reports,
protecting you against policy violations and avoiding the risks and errors
associated with day-to-day modifications. And, for fast troubleshooting, you
always get the original and current values.
To learn more
information on Change Auditor please visit: https://www.quest.com/change-auditor
Or for a Trial Download
of Change Auditor for Exchange and Exchange Online: https://www.quest.com/products/change-auditor-for-exchange/.
email this
•
digg
•
reddit
•
dzone
comments (0)
•
references (0)
Related:
Auditing Privileged Operations and Mailbox Access in Office 365 Exchange Online
5 Indicators of Endpoint Evil
Severing the Horizontal Kill Chain: The Role of Micro-Segmentation in Your Virtualization Infrastructure
Anatomy of a Hack Disrupted: How one of SIEM’s out-of-the-box rules caught an intrusion and beyond
How to control and detect users logging onto unauthorized computers
Fri, 11 Nov 2016 11:08:40 GMT
indows gives you several ways to control which computers a
given account can logon to. Leveraging
these features is a critical way to defend against persistent attackers. By limiting accounts to appropriate computers
you can
- Enforce written policies based on best practice
- Slow down or stop lateral movement by attackers
- Protect against pass-the-hash and related
credential harvesting attacks
The first place to start using mitigation technique is with
privileged accounts. And the easiest way
to restrict accounts to specified computers is with the allow and deny logon
rights. In Group Policy under User
Rights you will find an allow and deny right for each of Windows’ 5 types of
logon sessions
- Local logon (i.e. interactive logon at the
console)
- Network logon (e.g. accessing remote computer’s
file system via shared folder)
- Remote Desktop (i.e. Terminal Services)
- Service (when a service is started in the
background it’s service account is logged on in this type of session)
- Batch (i.e. Scheduled Task)
Of course if an account has both “Logon locally” and “Deny
logon locally” the deny right will take precedence. By careful architecture of
OUs, group policy objects and user groups you can assign these rights to the
desired combinations of computers and users.
But because of the indirect nature of group policy and the
many objects involved it can be complicated to configure the rights
correctly. It’s easy to leave gaps in
your controls or inadvertently prevent appropriate logon scenarios.
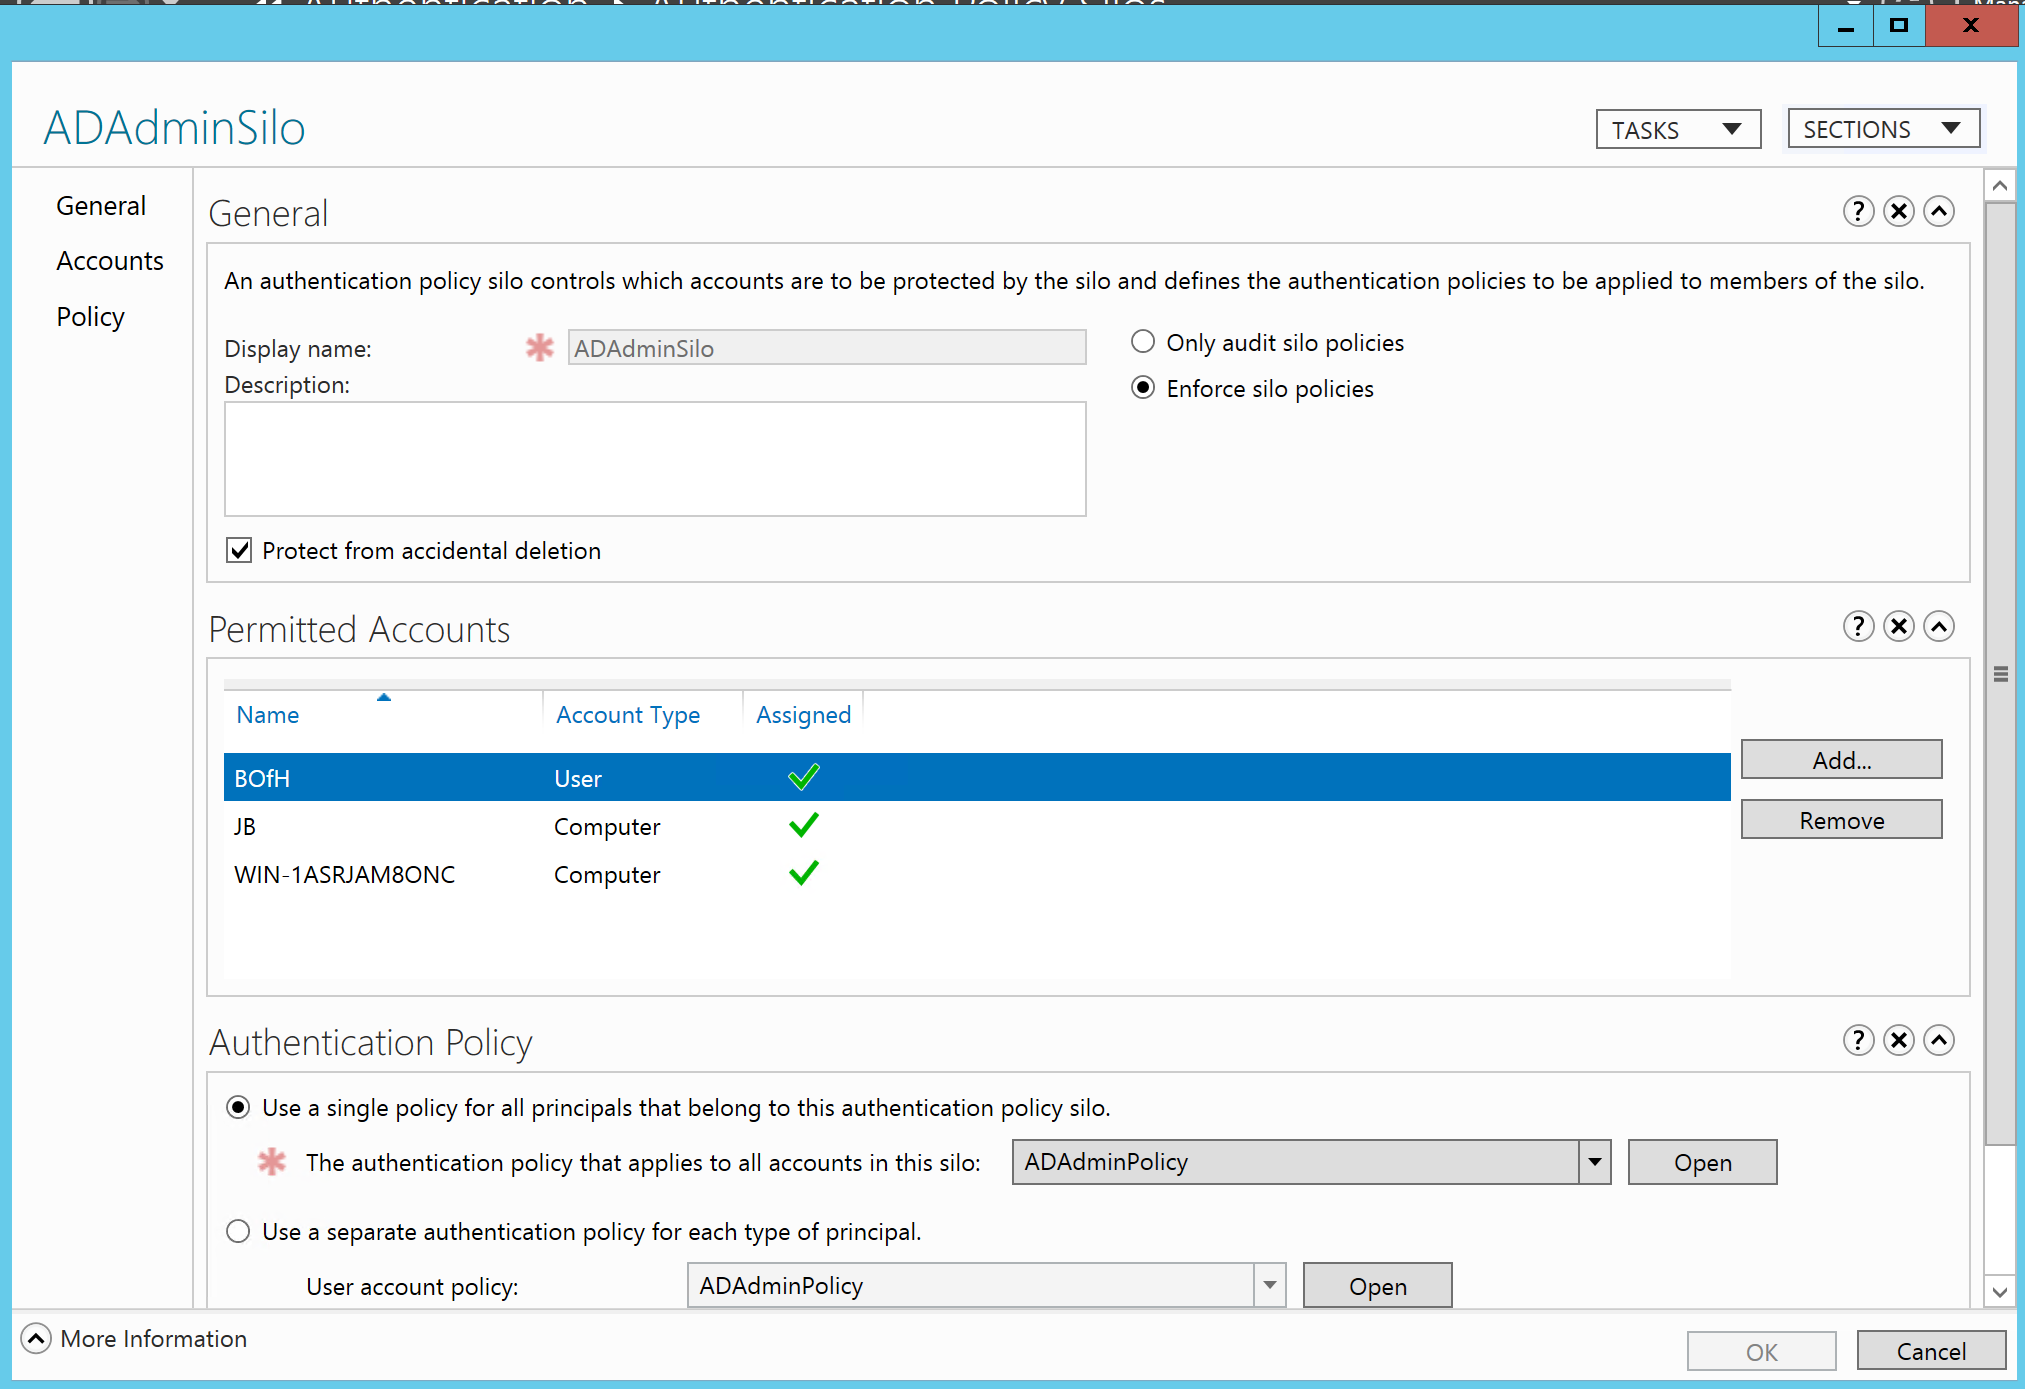
In Windows Server 2012 R2 Microsoft introduced
Authentication Policy Silos. Whereas
logon rights are enforced at the member computer level, silos are enforced
centrally by the domain controller. Basically
you create an Authentication Policy Silo container and assign the desired user
accounts and computers to that silo. Now
those user accounts can only be used for logging on to computers in that
silo. Domain controllers only enforce
silo restrictions when processing Kerberos authentication requests – not
NTLM. To prevent users accounts from
bypassing silo restrictions by authenticating via NTLM silo’d accounts must
also be members of the new Protected Users group. Membership in Protected Users triggers a
number of different controls designed to prevent pass-the-hash and related
credential attacks – including disabling NTLM for member accounts.
For what it’s worth Active Directory has one other way to
configure logon restrictions and that’s with the Logon Workstations setting on
domain user accounts. However, this
setting only applies to interactive logons and offers no control over the other
logon session types.
Detecting Logon Violation Attempts
You can monitor failed attempts to violate both types of
logon restrictions. When you attempt to
logon but fail because you have not been granted or are explicitly denied a
given logon right here’s what to expect in the security log.
|
Which Security Log
|
Event ID
|
Notes
|
|
Local computer being attempted for
logon
|
4625
Logon Failure
|
Failure reason: The
user has not been granted the requested logon type at this machine.
Status: 0xC000015B
|
|
Domain Controller
|
4768
Successful Kerberos TGT Request
|
Note that this is a successful
event. To the domain controller this
was as a successful authentication.
|
As you can see there is no centralized audit log record of
logon failures due to logon right restrictions. You must collector and monitor the logs of each computer on the network.
On the other hand, here are the event logged when you
attempt to violate an authentication silo boundary.
|
Which Security Log
|
Event ID
|
Notes
|
|
Local computer being attempted for
logon
|
4625
Logon Failure
|
Failure reason: User
not allowed to logon at this computer
Status: 0xC000006E
|
|
Domain Controller
|
4820 Failure
|
A
Kerberos Ticket-granting-ticket (TGT) was denied because the device does not
meet the access control restrictions.
The
silo is identified
|
|
4768 Failed Kerberos TGT Request
|
Result Code: 0xC
|
An obvious advantage of Authentication Silos is the central
control and monitoring. Just monitor
your domain controllers for event ID 4820 and you’ll know about all attempts to
bypass your logon controls across the entire network. Additionally, event ID 4820 reports the name
of the silo which makes policy identification instant.
Restricting privileged accounts is a key control in
mitigating the risk of pass-the-hash and fighting modern attackers. Whether you enforce logon restrictions with
user rights on local systems or centrally with Authentication Silos make sure
you don’t just use a “fire and forget” approach in which you configure but
neglect monitoring these valuable controls. You need to know when an admin is attempting to circumvent controls or
when an attacker is attempting to move laterally across your network using
harvested credentials.
"This article by Randy Smith was originally published by EventTracker"
www.eventtracker.com/newsletters/control-detect-users-logging-onto-unauthorized-computers/
email this
•
digg
•
reddit
•
dzone
comments (0)
•
references (0)
Related:
5 Indicators of Endpoint Evil
Auditing Privileged Operations and Mailbox Access in Office 365 Exchange Online
Live with Dell at RSA 2015
Severing the Horizontal Kill Chain: The Role of Micro-Segmentation in Your Virtualization Infrastructure
Severing the Horizontal Kill Chain: The Role of Micro-Segmentation in Your Virtualization Infrastructure
Wed, 12 Oct 2016 12:58:16 GMT
Keeping malware off and external threat actors out of your network is definitely important. But equally important is considering how to protect your network if a threat does find its way in.
 One of the first goals of any external threat actor after it accesses your organization’s network—whether via spear phishing, social engineering, or some other means of inserting malware onto and compromising a machine—is to spread out within your network and to access and infect as many machines as possible. This strategy is designed to maintain malicious access, should any individual instance of malware infection be discovered. Other attack methods can involve far more advanced and coordinated attacks in which multiple machines are compromised and installed malware lies dormant until triggered remotely.
This reality requires some means to minimize the ability of a threat to spread within your network. In a physical networking environment, isolating malware is difficult without the presence of agent-based software on every endpoint. But a software-defined data center (SDDC) can take advantage of new advances in network virtualization to identify and isolate the threat, integrating best-of-breed security vendor solutions.
 In this whitepaper, we’ll discuss network virtualization and micro-segmentation’s role in thwarting attacks. We’ll look at how micro-segmentation is implemented within a virtual infrastructure. And we’ll see how integrating third-party security solutions can provide the highest level of security and protection.
Network Virtualization and the SDDC
Three typical components are found in a data center: compute, storage, and networking. Virtualized compute has been a reality for more than a decade, with virtual storage present for a majority of that time as well. But only with the more recent availability of network virtualization—also known as software-defined networking (SDN)—has a true SDDC come to fruition. Network virtualization brings to the network the same programmatic creation, deletion, snapshotting, and restoration functionality that is employed at a virtual machine (VM) level. With these capabilities, network virtualization goes well beyond just another logical network and completes the vision of the SDDC by making the network software-defined as well.
By implementing network virtualization, your SDDC gains these benefits:
- Simplification of your physical network. Traditionally, the physical network is designed around bandwidth needs, geographic constraints (e.g., buildings, multiple floors, independent locations), and security. By virtualizing your network, you can eliminate the impact of security concerns on the physical design, enabling you to focus solely on bandwidth and geography issues. It’s important to note that to implement SDN, you are not required to reconfigure any part of your physical network; rather, taking advantage of SDN as you build a data center means that you can dramatically simplify the physical network topology.
- Agility and speed.Because network services in Layers 2 through 7 have been virtualized, the ability to create a customized virtual network can be achieved in seconds. This option includes benefits for those wanting to isolate a developer network or host a multi-tenant infrastructure.
- Automation.Through an API that conforms to Representation State Transfer (a RESTful API) and automation tools, the ability to set up and configure a virtual environment can now include networking in addition to compute, storage, network, and security.
- Security.With the agility to build networks quickly comes the ability to implement dynamic security models. This approach includes securing traffic between an application and the virtual client that accesses the application, spinning up a demilitarized zone (DMZ) anywhere, and (as this paper will discuss later) micro-segmenting the network to isolate applications, virtual clients, and virtual servers to sever the horizontal spread of malware throughout a network.
So where does this network virtualization exist?
Network virtualization lives within your hypervisor, acting as an abstraction layer between the physical network and your VMs, applications, and data.
A great example of a network virtualization solution is the VMware NSX platform, part of the VMware vision for the SDDC. NSX virtualizes the network and its physical components, allowing fast, robust configuration and security of a software-defined network.
VMWare NSX
Creating, maintaining, securing, and managing a virtualized network is no simple feat. To help you accomplish all these tasks, NSX is made up of a number of infrastructure components:
- NSX Manager. Implemented as a virtual appliance, NSX Manager automates the deployment and management of logical networks.
- NSX controller. Implemented as a cluster for redundancy, the controller is responsible for managing the hypervisor switching and routing modules.
- Hypervisor kernel modules. These add-on modules provide services that include distributed routing, the distributed firewall (DFW), and VXLAN-to-VLAN bridging.
- NSX Edge. This component provides seamless integration with the physical network, processing communication with the external network.
Put together, these components provide the management and security foundation to virtualize networking objects that are normally found in a physical environment, including logical switches, routers, firewalls, DHCP servers, and so on, as shown in Figure 1
Figure 1: NSX virtualizes traditional
physical networking components, making the network itself software-defined.
So, how can the NSX virtualization
platform help improve security and stop the horizontal kill chain?
Implementing Micro-Segmentation with NSX
One of the greatest benefits of network virtualization is the ability to divide a network into smaller virtual zones, called micro-segments. These micro-segments help to isolate services, applications, and VMs, providing protection by making security more dynamic and multilayered.
To create micro-segmentation, NSX uses a DFW residing on each VM’s virtual network card (vNIC). NSX manages the DFWs centrally to ensure consistent and up-to-date firewall rules.
DFW Rules
DFW rules are much like any rule that you might see on a given firewall. These rules define which traffic is allowed through the firewall by defining source and destination IP addresses, the service that is responsible for the traffic (defined as port-protocol combinations), and the action to be taken (allow/deny) within each rule.
When multiple DFW rules exist, the rule sequence doesn’t come into play—with the exception of deny rules, which take precedence. This scenario further simplifies rule creation and management.
In addition, each rule can either be applied to the default value of every DFW or be applied granularly within the NSX environment to specific VMware vSphere objects, including clusters, datacenters, vNetwork Distributed Switch (vDS) distributed port groups, logical switches, Edges, host systems, security groups, VMs, or vNICs. Keep in mind that even though a rule is applied to a specific DFW, the source and destination parameters within the rule must match the inspected traffic for the rule action to occur.
Even though DFW rules are useful, applying them to VMs doesn’t seem entirely sensible, does it?
Applying Practical Granularity via Security Tags
If you’re thinking about the practical application of this technology, you might be concerned that the granularity that a DFW rule provides doesn’t align with the way you want to manage server security. Think about it: You want the ability to apply a rule quickly and easily to all your database servers, every VM on a particular host, or every client VM that interacts with protected data (e.g., credit cards, patient information), right?
NSX provides the ability to apply DFW rules in a more user-friendly manner, by using a few pieces of technology within the NSX framework. The first of these pieces is security tags. Individual VMs can be assigned multiple security tags. Because tags are assigned to the VM, the tag remains part of the definition even if the VM is moved.
Tags are used within security policies, the second part of this “practical application” equation. In their most basic sense, security policies define how you want to protect a given VM. Each security policy contains rules that control DFWs, as well as guest-OS and network-introspection controls that integrate with partner solutions to provide additional layers of monitoring and protection. Security policies also have their own weight and inheritance methods to determine which policies are applied first.
So, how do you take advantage of tags and security policies?
The Secret Sauce: Security Groups
What makes NSX micro-segmentation so robust is the use of security groups. Security groups can have multiple security policies assigned to them and define which VMs should have those security policies (and therefore, the DFW rules) applied to them. Security groups employ both static and dynamic memberships to ensure that the most up-to-date policies are applied. This approach is critical, as DFW rules might need to be created and applied in response to a current attack.
As Figure 2 shows, security policies define how protection should be implemented, whereas the security group defines what should be protected.
Figure 2: Security policies and security groups work together to dynamically protect the vSphere environment.
Security group membership is defined using two inclusion sets and one exclusion set:
- Static inclusions. A static inclusion set includes static entries of VMs, clusters, logical switches, networks, vAPPs, datacenters, IP sets, Active Directory groups, MAC sets, security tags, vNICs, resource pools, distributed virtual switch port groups, and other security groups.
- Dynamic inclusions. A dynamic inclusion set includes matching computer names, OS names, VM names, security tags, and entity values, using comparative criteria statements such as “VM Name Contains ‘Oracle’”. Multiple sets of criteria are supported within a single security group.
- Static exclusions. These exclusions are processed after NSX tallies the final list of inclusions, ensuring that exclusions are never overridden.
Because security group members are both statically and dynamically defined, you can use membership to reference common functionality of servers (e.g., every VM running Oracle), location, data-classification levels, environment type (e.g., production versus development), department, and—most important when addressing the horizontal kill chain—current security state.
Dynamic inclusions make micro-segmentation truly useful in this scenario. Third-party vendors can tag a VM based on, say, an antivirus scan or an intrusion detection. A DFW rule (via a security policy) immediately takes effect to isolate the impacted VM and protect the rest of the network from the spread of malware.
Severing the Horizontal Kill Chain … and Beyond
With one of the goals of micro-segmentation being to stop the horizontal kill chain, you must embrace all three parts of the puzzle and configure DFW rules to isolate server, application, and client traffic, thus minimizing the risk of intrusion or infection in the first place. But it’s the addition of security policies and the dynamic inclusions within security groups that make DFW rules a granular, responsive tool.
By utilizing all three pieces—along with integrated third-party solutions that monitor and scan for intrusions, breaches, inappropriate access, malware, viruses, and more as the basis for security group membership—the simple DFW becomes the foundation for a powerful and flexible way of halting inappropriate and potentially malicious east-west traffic between VMs.
Getting to Zero Trust
Micro-segmentation can also be used to implement a zero-trust security model within your virtual network, in which no entity—users, devices, applications, or any other—has a default level of trust. This is based on the “never trust, always verify” security approach first proposed by Forrester Research.
Applying this approach within the context of micro-segmentation creates as secure an environment as possible. To do so, you’ll need to follow these steps:
- Baseline. Start with an approved set of allow rules for a given set of traffic between VMs and a default rule that Allows bus also Logs.
- Analyze. Review the traffic that the existing allow rules are not catching.
- Secure. Add more rules, taking advantage of more than just simple IP addresses.
- Repeat. Continue to analyze and add rules; the amount of traffic in the log decreases in response.
- Deny. Add temporary deny rules and, after you’re certain that all appropriate traffic is accounted for in your allow rules, add a final default rule to block all remaining traffic.
Micro-segmentation doesn’t get your organization all the way to zero trust. However, it does put in place a least privilege environment that aligns with the foundational goal of zero trust by limiting which VMs and applications can traverse a given virtualized network path.
Beyond Micro-Segmentation with Symantec
NSX is much more than micro-segmentation; it’s an extensible framework that allows security vendors like Symantec to leverage their security services, while extending the ability to protect and respond.
Without network virtualization (and all the capabilities it brings), malware on a given VM would certainly be detected, quarantined, and removed by AV at an OS level, with perhaps an alert sent. But with Guest and Network introspection rules (as part of an NSX Security policy), a vendor like Symantec can do some amazingly powerful and proactive protection of the network.
Symantec’s Data Center Security Server leverages VMware’s NSX platform to merge together anti-virus protection, insight reputation, and network-based threat detection and protection, providing a layered approach to comprehensively address a variety of attack vectors.
To protect against malware, Symantec utilizes a number of policies – some of their own, and some within NSX) to establish how intrusions are detected and responded to, as shown in Figure 3
Figure 3: Data Center Security Server controls the process of detecting, isolating, and eliminating threats via policies.
Protection starts with an NSX traffic shaping policy, to steer network traffic to a Symantec virtual appliance running on the same ESX host to facilitate the inspection of packets for malware. This can be accomplished for both east-west (server-server) and north-south (client-server) traffic. To optimize throughput of steered traffic, Symantec uses specific signatures tailored to certain workloads (for example, an Exchange server – the signature would contain traffic such as pop, smtp, imap, etc.). Should suspect traffic be found, a dynamic inclusion within a Security Group is triggered via a tag, causing more restrictive predefined Security Policies to activate and quarantine the system. Once malware is deleted from the VM in question, the tag is removed, causing it to be allowed back on the environment.
Traditional malware scans can also be used to establish tags and dynamic Security Group inclusions using Symantec’s agentless architecture. To optimize this process, all machines on a given ESX host are initially scanned, creating cached hashes of all files across all VMs on that host. As files are access, the hash is sent to the virtual appliance to be compared with the scan hash to speed up the AV scan process while maintaining the same level of protection as agent-based AV.
Placing the adaptable Data Center Security Server security architecture on top of the already flexible NSX platform empowers organizations to both detect intrusions (via file integrity scans) and prevent them (via enforced security policies, restriction of traffic flow, and limited app connectivity).
Achieving Better Security through Micro-Segmentation
Even as organizations move to a true SDDC, the reality of external threats grows, requiring those same organizations to implement new technologies and security methods to minimize the risk. Advances in network virtualization have made the implementation, maintenance, and security of virtual environments easier, faster, and more responsive to current business needs.
Micro-segmentation, as part of an overall network virtualization implementation, provides a means to dynamically manage the security of VMs, based on a variety of offerings and usage factors. But micro-segmentation will take your security only so far; in and of itself, it is only a means to establish a secure configuration.
Truly addressing the horizontal kill chain of attacks requires the addition of third-party security solutions to provide context around the proper micro-segmentation configuration. These solutions first identify when an attack occurs, use integration with network virtualization to isolate the threat, and allow the entire environment to remain secure while the threat is neutralized.
ABOUT SYMANTEC
Since its inception in 1982, Symantec has grown into a Fortune 500 company through a combination of internal development, strategic acquisition and partnering with industry leaders. At every step in the company’s growth we have expanded both our technological expertise and our understanding of customer needs. Our ability to successfully integrate internally developed with technologies we acquire has kept Symantec at the front of its industry and enabled us to provide best-of-breed solutions for millions of corporate and individual customers in more than 48 countries. It is what has earned the company almost every major technology award and top-tier rankings from industry analysts. www.Symantec.com
ABOUT RANDY FRANKLIN SMITH
Randy Franklin Smith is an internationally recognized expert on the security and control of Windows and AD security. Randy publishes www.UltimateWindowsSecurity.com and wrote The Windows Server 2008 Security Log Revealed—the only book devoted to the Windows security log. Randy is the creator of LOGbinder software, which makes cryptic application logs understandable and available to log-management and SIEM solutions. As a Certified Information Systems Auditor, Randy performs security reviews for clients ranging from small, privately held firms to Fortune 500 companies, national, and international organizations. Randy is also a Microsoft Security Most Valuable Professional. www.UltimateWindowsSecurity.com
DISCLAIMER & COPYRIGHT
Monterey Technology Group, Inc. and Symantec make no claim that use of this white paper will assure a successful outcome. Readers use all information within this document at their own risk. Ultimate Windows Security is a division of Monterey Technology Group, Inc. ©2006-2016 Monterey Technology Group, Inc. All rights reserved.
email this
•
digg
•
reddit
•
dzone
comments (0)
•
references (0)
Related:
5 Indicators of Endpoint Evil
Auditing Privileged Operations and Mailbox Access in Office 365 Exchange Online
Severing the Horizontal Kill Chain: The Role of Micro-Segmentation in Your Virtualization Infrastructure
Anatomy of a Hack Disrupted: How one of SIEM’s out-of-the-box rules caught an intrusion and beyond
5 Indicators of Endpoint Evil
Mon, 19 Sep 2016 16:16:12 GMT
With so much focus on security these days, you’d
think IT would be winning the battle against malware and other threats. But all
too often,
a lack of focus on certain areas of the
network leads to a decrease in an organization’s security posture and an
increase in risk.
The endpoint is such an area. Endpoints have more
than the ability to reach beyond the protective layers of
internal security—they’re allowed to do so.
End user behaviors such as working from outside the office,
connecting to unsecured WiFi networks, visiting potentially dangerous websites,
and opening email with malicious
attachments or links all make endpoints a particularly
vulnerable attack vector with access to your organization’s network.
According to a recent Ponemon report 80 percent of
organizations are seeing web-born malware attacks. Sixty-five percent have
experienced rootkit attacks and 55 percent have encountered spear
phishing—all on a frequent basis.
And when malware and endpoints mix, the attack
doesn’t stop with a single infected machine. Rather, that first infection turns
the machine into what is commonly known as
a beachhead. From there, malware is
designed to spread laterally throughout your network, in an effort to maximize
the chances of obtaining valuable credentials or data.
Although your thoughts might immediately go to
attack mitigation and prevention, most organizations—a whopping 70 percent,
according to the Ponemon study—have difficulty enforcing endpoint security
policies.
Rather, detection is a key aspect of any
strategy. The best approach is to use the endpoint as a sensor, collecting
state information, understanding which behavior is normal, and identifying what
isn’t.
In this whitepaper, we focus on five trouble
indicators, each of which provides additional context around what to look for
on your endpoints:
- Rogue processes
- Evidence of
persistence
- Suspicious traffic
Activity and user-role mismatches
- Unusual OS
artifacts
For each indicator, we tell you what to look for,
as well as which tools you can use to identify and gather intelligence around
the malicious code that might be lurking within your endpoints.
Indicator #1: Rogue Processes
Successful attackers depend on their malware to go
undetected. After all, malicious remote administration tools (RATs) are
designed to provide access to the command prompt, file system, registry,
hardware, remote control, and more, with the purpose of
providing many ways to find, extract, hold hostage, or destroy your
organization’s critical information. If RATs were easy to find, the attack
wouldn’t stand a chance—so attackers use several methods to
obfuscate their presence.
Evil Methods
- Process looks
good … on the surface. The process name (such as explorer.exe) is
right, but the parent process, logon user, or file path is incorrect. You need
to look not just
at the process in question, but also at the process that
started it. If that process is not standard, it could indicate that the child
process is a rogue process. Another method that attackers use is
a clever misspelling of the file name. For example, a rogue
file might be named scvhost.exe instead of svchost.exe—a spelling that is so
close, you would probably need to compare file names to confirm the
misspelling.
- Suspicious DLL
execution. Dynamic Link Libraries (DLLs) contain modular code to help
support a main application. Attackers often take advantage of the fact that
parts of the core Windows OS heavily utilize DLLs:
- rundll32.exe. Known as a command
line utility program, rundll32.exe is responsible for running DLLs by invoking
a function that is exported from a specific 16-bit or 32-bit DLL module.
- svchost.exe. Svchost is a generic
Windows OS program that hosts approved Windows services. Malicious applications can be formed as DLLs
specifically made to work with svchost.exe and trick it into running
them.
- Other legitimate
processes. The use of DLLs is common, so rogue DLLs can also be
loaded into an otherwise benign application.
- Rootkits. These are nasty stuff.
By definition, they take advantage of administrative (root) access, embed
themselves into an OS, and then intelligently evade detection.
Regardless of the tactic used, the goal of rogue
processes is either to make the process look legitimate or to use a legitimate
process to launch a malicious DLL, making it more difficult to identify and
track via the security log.
Detecting Rogue Processes
Ideally, you have a centralized way to collect
relevant process information across your network and automatically identify
rogue processes—capabilities that are available via solutions like
EventTracker.
Here is the kind of analysis required to catch rogue
processes.
- Analyze event ID
4688. This event is generated each time a new process is created. The
event provides relevant information that you can use to identify rogue
processes. As Figure 1 shows, this information includes the name of the user
account that launched
the process, the date and time the program started, the
process ID, the parent (creator) process ID, and the full path of the process
executable.
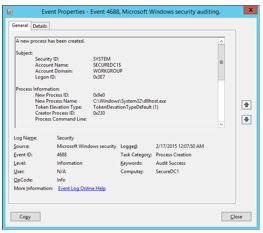
-
Note: Although this event shows
the Creator Process ID, there is no associated name or a full path to that
process, which is an important piece in determining whether a process is rogue.
The parent (creator)process can be determined by manually searching for an
earlier 4688 event with
a New Process ID that matches this Creator Process ID value.
After enabling Audit process
events via Group Policy, your endpoints will log a massive number of
events, so although this is a valuable way to get information, you’ll also need
to wade through a sea of data. Furthermore, the event is not generated when
DLLs are loaded, only when new processes are started.
So if the rogue process is a DLL hiding in a file such as
svchost.exe, the event logs won’t contain any clue that it was invoked.
However, after you identify something amiss on a given machine, memory
forensics tools such as those from the Volatility Foundation
can
help provide further forensics detail when DLLs are injected
or rootkits installed.
- Check for
unsigned code/Malware and viruses are often attached to legitimate
executables from known or somewhat known entities. Program files that are
signed declare the publisher and confirms that has not been modified by an
attacker. Since unsigned files don’t have this assurance, unsigned code
might indicate potential malware – you just can’t tell. Note
that Windows 8 and earlier default to allowing unsigned code to run.
Several tools can audit and analyze running
processes on a machine. Although not enterprise-caliber tools, these can be
useful in tracking down issues on a per-machine basis:
- Check programs
against the National Software Reference Library (NSRL). This library
(available at http://www.nsrl.nist.gov) is a joint effort between the U.S.
Department of Homeland Security; federal, state, and local law enforcement; and
the National Institute of Standards and Technology (NIST) to collect software
from various sources and incorporate file profiles into a reference library to
be used in the investigation of crimes involving computers.
At the end of the day, the trick to detecting rogue
processes is to know what should and should not be running on your Windows
endpoints. If you’re using a golden image, this exercise should be relatively
simple: compare the running processes with a known list. But if every machine
is somewhat different, you might need to start with a basic list of what should
be running and then use the methods here to detect what falls out of the
norm.
Detecting Rogue Processes with
EventTracker
Even with the appropriate auditing policies turned
on, you will need to do a fair amount of detective work to get a complete
picture of which processes are running and whether they are rogue.
EventTracker’s sensor collects pertinent information—including process, file,
creator, hash, and signer details—and intelligently present it as a single
event, as shown in Figure 2. This approach creates centralized details that are
easily available for security information and event management (SIEM) solutions
to
digest and act on.
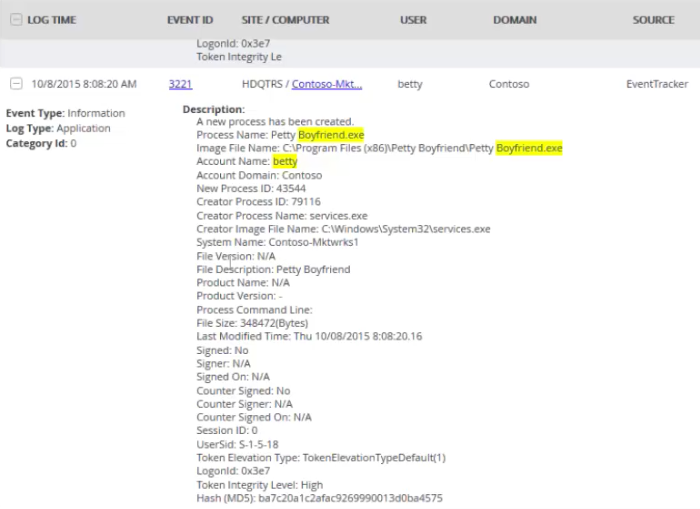
In addition, other events, such as Exchange message
tracking, provide critical details. In the example that Figure 3 shows, you can
use the originating IP address, email subject, sender and recipient addresses,
and more to identify how rogue processes might be entering the
organization.
Moreover, EventTracker automatically compares
program files against the National Software Reference Library, looks for
unsigned code and alerts you to these and other suspicious
indicators.
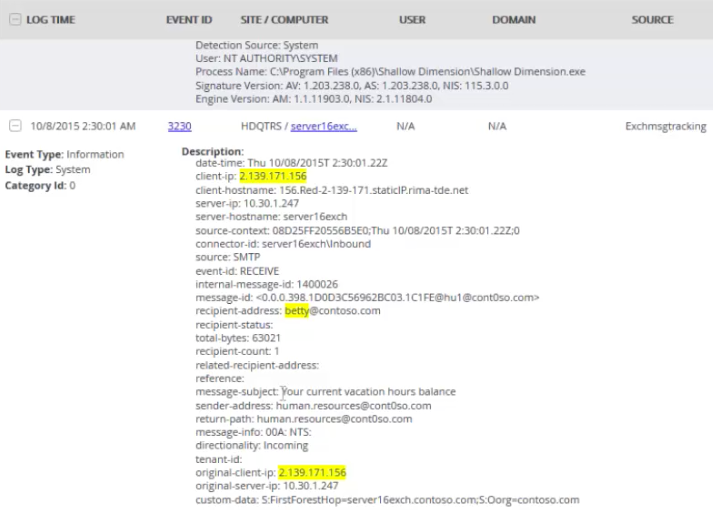
Indicator #2: Evidence of Persistence
An attacker doesn’t want to retain control of your
endpoints for a short period; their malicious code needs ample time to permeate
your network to give them the greatest chance of finding just the right
credentials and give them access to valuable information. Attackers need to
ensure that their code can live on so that they can resume control even after
the closing of a process, a logoff, or a reboot.
Evil Methods
This list, though not exhaustive, represents many
ways that attackers ensure their malicious code remains actively running and in
existence on the endpoint.
- Tasks.
Use of the AT command or scheduling tasks to run every minute or at logon, can
cause an endpoint to continually relaunch a malicious process.
- Tampering with
services. Replacing service path settings in the registry or
replacing a service executable can launch malicious processes at boot up. In
addition, new services are created with generic but official-looking names such
as Windows Services Update, to throw you off the scent. MSInfo is a good
starting point to identify those services that aren’t required.
- Auto-run registry
settings. The Run and RunOnce
settings found in several locations in the registry are perfect places to
nestle a reference to a malicious executable. MSInfo can play a role in
identifying what is configured to launch at bootup and logon.
- DLL tampering or
interception. The basic premise is either to modify the DLL’s import
table to reference a malicious function or to modify the DLL code itself to
detour to your code and then return it to its normal function.
- PowerShell
background jobs. A PowerShell process is spawned in the background
and runs the code necessary to keep the malicious process resident.
- Local Group
Policy. Group Policy contains a place to configure both startup
scripts and logon scripts.
- Browser add-ins
and plug-ins. Browsers have the potential for a lot of local access
to the endpoint, giving a browser the ability to re-infect a machine every time
it is opened.
Detecting Persistence
Look to the same methods that attackers use der to
find entries that are designed to guarantee persistence.
Note: Many malicious processes use more than one method to
redundantly ensure their survival. Finding references to a rogue process in any
of these locations is a indicator that it might be malicious.
Indicator #3: Suspicious traffic
Malicious code on an endpoint doesn’t exist simply
to sit there. It’s designed to replicate itself within the network and to
ultimately exfiltrate information from the network. Therefore, traffic
monitoring is another way to identify the existence of malicious
code.
You might think that you can simply use your
network monitoring sensors to pick up suspicious traffic. However, the reality
is that you need additional context only available on the endpoint, such as the
executable that is used to generate traffic, to ensure proper identification of
suspicious activity.
Evil Methods
If you find the following on your endpoints, they
could equate to suspicious network traffic:
- Use of browser
ports by non-browsers. Ports 80, 443, or 8080 should represent web
services. Attackers use these ports to update code and exfiltrate data because
the ports are always left open on your firewall. Network packets show you only
which endpoint sent traffic over which port to which IP address; they won’t
show that the traffic was a rogue DLL called by svchost.exe that was used to
send data.
- Use of browsers
over non-standard ports. Any browser not using standard ports, such
as 80, 443, or 8080, could indicate a valid process (your browsers) with a
malicious purpose.
- Unexpected
traffic. Traffic might seem normal but become suspect when you
consider either the source or the target. A few examples include web traffic to
an IP address instead of a fully qualified domain name (FQDN); Remote Desktop
Protocol (RDP), FTP (File Transfer Protocol), or Secure Shell (SSH) sessions
from abnormal endpoints; and even outbound Simple Mail Transfer Protocol (SMTP)
sessions to an external host.
Detecting Suspicious Traffic
As mentioned earlier, just using a network sensor
lacks context. You need to know not only from which endpoint traffic
originated, but also from which process. There are a few steps you can take to
investigate suspicious traffic:
- Monitor events
5154, 5155, 5156, and 5157. These events come from the Windows
Filtering Platform (WFP) and help to document the permitting and blocking of
inbound and outbound TCP or UDP connections. In each of these events, the
process ID, application path, source and destination IP
addresses, ports, and protocol are all documented, providing
you context around whether the combination of processes and ports adds up to
malicious or appropriate traffic.
- Monitor outbound
DNS requests for unusual domain names. What determines “unusual”? Use
of a reputation service might be a good fit to help provide guidelines around
appropriate domain names.
-
The overarching goal is to use the combination of traffic
patterns, the processes that generate them and the type of endpoint to
establish suspicion. Without a third-party solution, you’ll need to look
granularly at specific endpoints, searching for these mismatches of processes
and traffic patterns.
Indicator #4: Activity and User-Role
Mismatches
An attacker will use any means necessary to spread
malicious code laterally throughout the organization and exfiltrate data—even
if it means doing so in a way that doesn’t fit the normal mode of operation for
the user of the endpoint. Therefore, look for anomalies in which activity
doesn’t align with the user’s role in the organization. For example, consider
traffic for a
given type of endpoint, such as an RDP session coming from
the desktop of a user in Accounting. If their workstation has never started an
RDP session in the past but suddenly does so now, you have a potential
candidate for an infected endpoint.
Evil Methods
As suspicious traffic can be indicative of
malicious code, so can the use of tools that are rarely, if ever, used by
non-IT users:
- Utilities. Many of the tools that
IT considers foundational to configuring and supporting endpoints and networks
are all but a foreign language to regular users. This list includes (but is not
limited to) cmd.exe, rar.exe, at.exe, schtasks.exe, wmic.exe, powershell.exe,
winrm.vbs, net.exe, reg.exe, sc.exe, netstat.exe, and route.exe
- Remote
sessions. We’ve talked about RDP from a traffic standpoint, but you
should also watch for it from an activity standpoint. Normal users (except thin
client and VDI users) usually have no need to connect to a server via RDP.
- Unique mismatches
in your environment. You should devote some time to comparing the
usage difference between end-user and admin endpoints to determine which
applications (via processes) they normally run to create a profile.
Detecting Activity and User-Role
Mismatches
The simplest distinction to make is whether an
endpoint is normally used by a user or someone in IT. But in your organization,
the issue might be more complex than that; a user might be responsible for
initiating managed file transfers as part of their job, so an FTP session might
be in order. No matter the complexity of roles within your organization,
identifying roles and their corresponding profile of activity is the first step.
Next, identify which applications are being used. This
step is much more difficult to accomplish without at least a simple tool, such
as the old Process Monitor from Systernals with output to a CSV file.
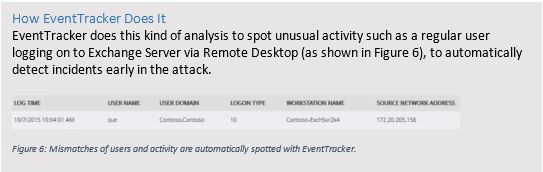
Indicator #5: Unusual OS Artifacts
It’s very difficult for attackers not leave some
kind of trace in Windows of their presence. Knowing what to look for can help
you catchattackers at any point in the process.
The point here is to search out things not normally
found on end-user workstations. Here are a few examples:
- Scripts. If PowerShell, VB
Script, or even a command prompt was used to execute a command script, scripts
might be left over, leaving clues as to what was executed.
- RDP files. If RDP sessions have
been used, files that define connection configurations might exist.
- Shared folders on an endpoint.
Because exfiltration of data is a large part of these attacks, simple shared
folders might be used to centralize obtained files so that they can be
exfiltrated from a single machine.
- Shared folders access by an
endpoint. Looking at the previous artifact from the other
perspective, a given endpoint might have been used to connect to a central
share. A review in the registry of the following key can provide more detail on
which shares have been accessed:
KEY_CURRENT_USER\SOFTWARE\Microsoft\Windows\CurrentVersion\Explorer\MountPoints2
Shining the Spotlight on Endpoint Evil
Endpoints are here to stay for most organizations
and will continue to be a major risk area. Using the endpoint itself as a
security sensor—one that can provide information, detail, and context of
attempted breaches—can provide IT with the intelligence it requires to properly
detect and respond to attacks.
Much of the work highlighted in this paper requires
a massive amount of effort once you move past just a few endpoints. The only
way to catch attackers using these methods is to automate and EventTracker is
leading the way. EventTracker’s mature SIEM engine provides the centralized
analysis and point of management needed to handle thousands of endpoints.
Moreover, on the endpoint, EventTracker has advanced beyond the traditional
SIEM agent. EventTracker empowers your endpoints as
security sensors where you need them the most. Instead of
just forwarding event logs, EventTrackers sensor-agent watches system activity
in real-time on each and every endpoint looking for the indicators discussed in
this paper. With EventTracker you get visibility and alerting to a depth and
currency only possible with by leveraging agents on the endpoint.
ABOUT EVENTTRACKER
EventTracker offers a dynamic suite of award
winning products for SIEM and event log management. SC Magazine BestBuy
EventTracker Enterprise processes hundreds of millions of discrete log messages
to deliver vital and actionable information, enabling organizations to identify
and address security risks, improve IT security, and maintain regulatory compliance
requirements with simplified audit functionality. Security Center offers
instant security alerts and a real-time dashboard for viewing every incident in
the infrastructure,
and Compliance Center is a monitoring and early threat
detection tool.
Complementing these products is SIEM
Simplified(SM), our award winning services offering to augment IT resources in
smaller enterprises. Our experienced staff assume responsibility for all
SIEM-related tasks including daily incident reviews, daily/weekly log reviews,
configuration assessments, incident investigation support and audit
support.
Our customers span multiple sectors including
financial, communications, scientific, healthcare, banking and government, with
solutions currently deployed at over 850 global customer sites.
EventTracker was founded in 1999 and is privately
funded and held. Our corporate headquarters are located in Columbia, Maryland
in the Baltimore-Washington high tech corridor, with research and development
facilities located in both Columbia and Bangalore, India.
www.eventtracker.com
ABOUT RANDY FRANKLIN SMITH
Randy Franklin Smith is an internationally
recognized expert on the security and control of Windows and AD security. Randy
publishes
www.UltimateWindowsSecurity.com and wrote The Windows Server 2008
Security Log Revealed—the only book devoted to the Windows security log. Randy
is the creator of LOGbinder software, which makes cryptic application logs
understandable and available to log-management and SIEM solutions. As a
Certified Information Systems Auditor, Randy performs security reviews for
clients ranging from small, privately held firms to
Fortune 500 companies, national, and international
organizations. Randy is also a Microsoft Security Most Valuable
Professional.
DISCLAIMER & COPYRIGHT
Monterey Technology Group, Inc. and EventTracker
make no claim that use of this white paper will assure a successful outcome. Readers
use all information within this document at their own risk. Ultimate Windows
Security is a division of Monterey Technology Group, Inc. ©2006-2016 Monterey
Technology Group, Inc. All rights reserved.
This article by Randy Smith was originally published by EventTracker
http://www.eventtracker.com/webinars/top-5-indicators-of-evil-on-windows-hosts-endpoint-threat-detection-and-response/
email this
•
digg
•
reddit
•
dzone
comments (0)
•
references (0)
Related:
5 Indicators of Endpoint Evil
Auditing Privileged Operations and Mailbox Access in Office 365 Exchange Online
Understanding the Difference between “Account Logon” and “Logon/Logoff” Events in the Windows Security Log
Anatomy of a Hack Disrupted: How one of SIEM’s out-of-the-box rules caught an intrusion and beyond
Detecting Ransomware: The Same as Detecting Any Kind of Malware?
Mon, 05 Sep 2016 13:02:22 GMT
Ransomware has burst onto the scene with high profile
attacks against hospitals and other organizations. How do you detect ransomware? Ransomware is just another kind of malware
and there’s nothing particularly advanced about ransomware compared to other
malware.
Ransomware uses the same methods to initially infect an
endpoint such as drive-by-downloads, phishing emails, etc. Then it generates necessary encryption keys,
communicates with command and control servers and gets down to business
encrypting every file on the compromised endpoint. Once that’s done it displays
the ransom message and waits for the user to enter an unlock code purchased
from the criminals. So at the initial stages
of attack, trying to detect ransomware is like any other end-point based
malware. You look for new EXEs and DLLs
and other executable content like scripts. For this level of detection check out my earlier webinars with
EventTracker
As criminals begin to move from consumer attacks to
targeting the enterprise, we are going to see more lateral movement between
systems as the attackers try to either encrypt enough endpoints or work their way
across the network to one or more critical servers. In either case their attacks will take a
little longer before they pull the trigger and display the ransom message
because they need to encrypt enough end-user endpoints or at least one critical
server to bring the organization to its knees. These attacks begin to look similar to a persistent data theft (aka APT)
attack.
Detecting lateral movement requires watching for unusual
connections between systems that typically don’t communicate with each other. You also want to watch for user accounts
attempting to logon to systems they normally never access. Pass-the-Hash indicators tie in closely with
later movement and that one of the things discussed in “Spotting
the Adversary with Windows Event Log Monitoring: An Analysis of NSA Guidance”.
So much of monitoring for Ransomware is covered by the
monitoring you do for any kind of malware as well as persistent data theft attacks. But what is different about Ransomware? Basically 2 things
- Detonation: The actually detonation of
ransomware (file encryption) is a very loud and bright signal. There’s no way to miss it if you are watching.
- Speed: Enterprise ransomware attacks can potentially
proceed much faster than data theft attacks.
Detonation
When ransomware begins encrypting files it’s going to
generate a massive amount of file i/o – both read and write. It has to read every file and write every
file back out in encrypted format. The
write activity may occur on the same file if directly being re-written, the
ransomware can delete the original file after writing out an encrypted
copy. In addition, if you watch which
files ransomware is opening you’ll see every file in each folder being opened one
file after another for at least read access. You will also see that read activity in bytes should be matched by write
activity.
Of course there are potential ways ransomware could cloak
this activity by either going low and slow, encrypting files over many days or
by scattering its file access between many different folders instead of
following an orderly process of all files in one folder after another. But I think it will a long time before enough
attacks are getting foiled by such detection techniques that the attackers go
to this extra effort.
How prone to false positives is this tactic? Well, what other legitimate applications have
a similar file i/o signature? I can't think of any. Backup and indexing
programs would have a nearly identical file read
signature but would lack the equal amount of write activity.
The downside to ransomware detonation monitoring is that
detection means a ransomware attack is well underway. This is late stage notification.
Speed
Ransomware attacks against an enterprise may proceed much
faster than persistent data theft attacks because data thieves have to find and
gain access to the data that is not just confidential but also re-saleable or
otherwise valuable to the attacker. That
may take months. On the other hand,
ransomware criminals just need to either:
- Lockdown at least one critical server – without
which the organization can’t function. The
server doesn’t necessarily need any confidential data nor need it be
re-saleable. On a typical network
there’s many more such critical servers than there are servers with data that’s
valuable to the bad guy for re-sale or other exploitation.
- Forget servers and just spread to as many
end-user endpoints as possible. If you
encrypt enough endpoints and render them useless you can ransom the
organization without compromising and servers at all. Endpoints are typically much easier to
compromise because of their intimate exposure and processing of untrusted
content and usage by less security savvy end-users among other reasons.
So beefing up your ransomware monitoring means doing what
you hopefully are already doing: monitoring for indicators of any type of
malware on your network and watching for signs of lateral movement between
systems. But for ransomware you can also
possibly detect late stage ransomware attacks by watching for signature file
i/o by unusual processes. So you need to
be fast in responding.
And that’s the other way that ransomware differentiates
itself from data theft attacks: the need for speed. Ransomware attacks can potentially reach
detonation much faster than data thieves can find, gain access and exfiltrate
data worth stealing. So, while the
indicators of compromise might be the same for most of all ransomware or
persistent data theft attack, reducing your time-to-response is even more
important with ransomware.
“This article by Randy Smith was originally published by EventTracker”
http://www.eventtracker.com/newsletters/detecting-ransomware/
email this
•
digg
•
reddit
•
dzone
comments (0)
•
references (0)
Related:
Auditing Privileged Operations and Mailbox Access in Office 365 Exchange Online
5 Indicators of Endpoint Evil
Severing the Horizontal Kill Chain: The Role of Micro-Segmentation in Your Virtualization Infrastructure
Live with Dell at RSA 2015
previous | next
powered by Bloget™